
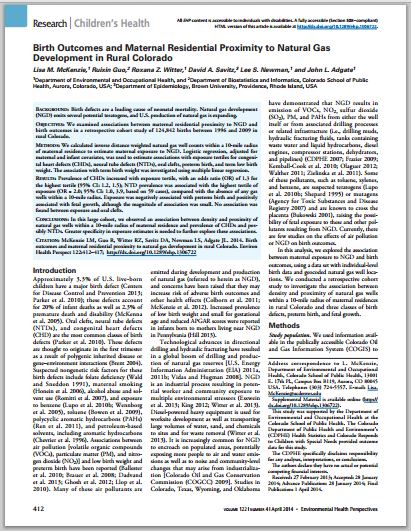
Exposures from Oil and Gas Development and Childhood Leukemia Risk in Colorado: A Population-Based Case–Control Study by Lisa M. McKenzie, William B. Allshouse, David R. Johnson, Christopher C. DeVoe, Myles Cockburn, Debashis Ghosh, May 2, 2025, Cancer Epidemiol Biomarkers Prev (2025) 34 (5): 658–668.
https://doi.org/10.1158/1055-9965.EPI-24-1583
Open the PDF for in another window
Abstract
Background:
Children living in upstream oil and natural gas (O&G) areas may be exposed to leukemogens and at increased risk for acute lymphoblastic leukemia (ALL).
Methods:
We conducted a case–control study of children born in Colorado between 1992 and 2019. We matched 451 children diagnosed with ALL at ages 2 to 9 years starting in 2002 to 2,706 controls based on birth month/year and Hispanic ethnicity. We estimated upstream O&G activity intensities from conception through a 10-year latency using our intensity-adjusted inverse distance weighted (IA-IDW) model. We applied logistic regression models adjusted for confounders to evaluate associations between ALL and IA-IDW.
Results:
For children within 5 km of an O&G well site, we observed a 62% [OR = 1.62; 95% confidence interval (CI), 0.964–2.62], 84% (OR = 1.84; 95% CI, 1.35–2.48), and 100% (OR = 2.00; 95% CI, 1.14–3.37) increase in ALL risk for low, medium, and high IA-IDW groups, compared with the referent group. Within 13 km, we observed a 59% (OR = 1.59; 95% CI, 1.03–2.37), 40% (OR = 1.40; 95% CI, 1.09–1.80), and 164% (OR = 2.64; 95% CI, 1.80–3.86) increase in ALL risk for low, medium, and high IA-IDW groups.
Conclusions:
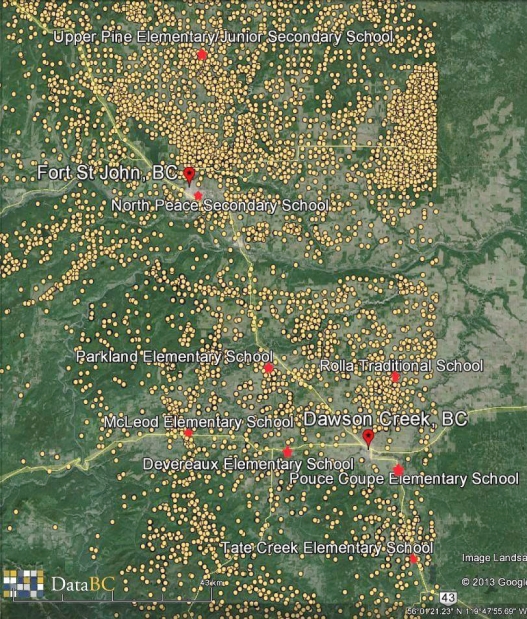
Colorado’s children living within 13 km of O&G well sites are at increased risk for ALL, with children within 5 km bearing the greatest risk. ![]() That’s most of Alberta, and most of NEBC, and much of SK and more!
That’s most of Alberta, and most of NEBC, and much of SK and more!![]() Current setbacks between O&G well sites and residences may not be sufficient to protect the health of these children.
Current setbacks between O&G well sites and residences may not be sufficient to protect the health of these children.
Impact:
Our results can be applied to policies to reduce childhood leukemogen exposures.
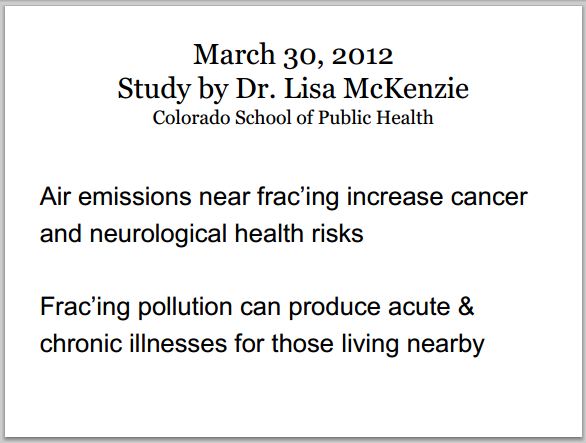
…
Discussion
In this study, we found that children aged 2 to 9 years diagnosed with ALL between 2002 and 2019 were 1.40 to 2.64 times more likely to live within 13 km of an O&G well site than children without a cancer diagnosis after adjusting for the child’s sex and birth weight, the mother’s age and rurality of address, IA-IDW of other sources of air pollution, UV exposure, and proximity to a major highway. Our results also indicate potentially elevated measures of association for exposures occurring during the perinatal period although these results are not conclusive. We found the burden of ALL risk to differ with the distance of the birth residence from the nearest O&G well site, as well as the intensity of O&G well site activity around the birth residence in regions with active upstream O&G development.
Previous case–control studies of children in Pennsylvania and rural Colorado also indicated positive associations between ALL and proximity to O&G well sites (12, 13). In this study, we observed lower associations than the 3 to 4 OR reported for children aged 5 to 24 years in our previous study in rural Colorado (12). The difference may be due to a more rigorous study design (registry-based vs. population-based), the inclusion of urban and suburban areas, and improved specificity of the exposure metric (IA-IDW vs. IDW), as well as adjustment for other environmental exposures in this study. Clark and colleagues (13) reported that children diagnosed with ALL between the ages of 2 and 7 years were 1.74 times more likely to have at least one unconventional O&G well within 2 km of their home within a window of three months prior to conception through to diagnosis, with results for buffer sizes of 5 and 10 km elevated but attenuating toward the null. Although this is within the 1.64 to 2.01 range we observed within our 3-km buffer, we did not observe an attenuation of association in our 5- and 13-km buffers. Because of the low prevalence of children living in their 2-km (2%), 5-km (7%), and 10-km (15%) buffers, Clark and colleagues did not apply an IDW measure of exposure or consider the intensity of activity at well sites. Instead, they considered a dichotomized exposure (e.g., presence or nonpresence of an O&G well within each buffer), which may have increased imprecision in exposure measurement as buffer size increased and biased results toward the null. Clark and colleagues did not consider buffers greater than 10 km.
Our results indicate that in regions with upstream O&G development, it is necessary to consider the density of wells and the level of activity on well sites in addition to the distance from the nearest O&G well in policies and epidemiologic studies. We observed that children living within 5 km of an O&G well and with O&G activity above the 80th percentile bear the greatest ALL risk. However, children living within 13 km of an O&G well and with O&G activity between the 20th and 80th percentiles also bear an increased risk of ALL. Although children living within 16 km of one O&G well and with O&G activity below the 20th percentile do not seem to experience an increased ALL risk, caution is warranted in interpretation because there are fewer than 50 cases in the low exposure group (Supplementary Table S4). One hundred percent of children in the high IA-IDW group for the 16-km buffer had a birth residence within 5 km of at least one O&G well site (Figs. 2 and 3) and an IA-IDW well count above the 80th percentile (2,308 and 132,254 intensity of well activity/km2). Ninety-nine percent of children in the medium IA-IDW group for the 16-km buffer (Supplementary Table S5) had a birth residence within 13 km of at least one O&G well site (Figs. 2 and 3) and an IA-IDW between the 20th and 80th percentiles (3.96 and 2,308 intensity of well activity/km2). One hundred percent of the children in the low IA-IDW group for the 16-km buffer had a birth residence within 16 km of at least one O&G well site (Fig. 2) and an IA-IDW ≤20th percentile. The 60% increase in effect size for the high exposure group observed in the 13 km may indicate that limiting analysis to smaller buffer sizes (e.g., 3 and 5 km) could lead to the inclusion of exposed children in the referent group and bias results toward the null.
The Colorado 2,000-foot setback (48) as well as the California 1-km setback, which is the largest setback between O&G well sites and residences in the United States (49), may not be sufficient to protect children from an increased burden of ALL risk. The results of Clark and colleagues (13) indicate increased ALL risk for children living up to 2 km from the nearest O&G well site, regardless of the intensity of O&G well site activities. Our results indicate increased ALL risk up to 13 km from the nearest O&G well site and provide clear evidence that the intensity of activity and the density of well sites around the birth residence, in addition to the distance to the nearest O&G well, affect the burden of ALL risk. For example, the nearest O&G well was further than 1 km from the birth residence for 33% and 95% of children in the high and medium IA-IDW groups, respectively, for the 16-km buffer (Fig. 2).
Although the etiologic pathway underlying an association between O&G activity and childhood ALL is unknown, the leukemogenic potential of air pollutants, such as benzene and PAHs, released in the areas of O&G activity is a plausible mechanism. For example, benzene metabolites, including t,t-muconaldehyde (aka E,E-muconaldehyde), benzene oxide, and benzoquinone, readily react with peptides, proteins, and DNA, thereby interfering with cellular function (56, 57). Benzoquinone formation in the bone marrow is a key step in leukemogenesis (56, 57). At ambient levels, benzene is preferentially metabolized through a pathway producing the cytotoxic metabolite, t,t-muconaldehyde (58–60). Human cells treated with t,t-muconaldehyde exhibit increases in reactive oxygen species (59), which can damage cellular nucleic acids (61, 62) and result in hematotoxicity and carcinogenesis (63, 64). In rodent cells, t,t-muconaldehyde is a potent inhibitor of gap junction channels, which has been linked to carcinogenesis and abnormal hematopoietic development (65, 66). Leukemogenic PAHs contained in diesel exhaust can lead to genetic toxicity by covalently binding to DNA (67). If not repaired, the resulting DNA adducts may be mutagenic and result in the disruption of the cell’s microenvironment, enzyme inhibition, cell death, and carcinogenesis (68). Although most ALL cases arise from B-cell somatic mutations (69), the somatic mutations to expect in ALL caused by benzene are unclear. Future research with phenotyping of ALL would advance the understanding of the etiologic pathway.
Children are particularly vulnerable to risks from elevated levels of leukemogens in their homes because high cell proliferation and rapid DNA turnover in early life provide a greater opportunity for DNA damage (65). Furthermore, young children spend a greater portion of their time at home (65)..
Our rigorous population-based case–control study design and large study population are sufficient to detect differences in ALL incidence between cases and controls and establish temporality. Because all our data were obtained from the CCCR and Colorado’s birth registry, neither recall bias nor measurement bias affected our results. Although the possibility of random errors does exist in the registries, they are unlikely to affect our findings (70). We focused on ages of diagnosis (2–9 years) that are inclusive of ages of peak childhood ALL incidence and exclusive of ages for infant ALL (71). We reduced the potential for exposure misclassification by employing our validated spatiotemporal industrial activity model to improve the assessment of exposure that incorporates region-specific, data-driven weights based on empirical measures of emissions from O&G sites to quantify the relative intensity of air pollution emissions across four distinct O&G activity phases (i.e., construction, drilling, completions, and production; refs. 28, 30). Our model’s predicted O&G activity is strongly correlated with measured hydrocarbon concentrations over all phases of well development (rSpearman = 0.74, P < 0.001) and is able to distinguish high-intensity phases, such as well completions, from low-intensity activities, such as production. Additionally, our model yielded a 19 times greater dynamic range of estimates compared with the simple IDW model, demonstrating a greater ability to identify a contrast in exposure to upstream O&G development among individuals.
Although we considered exposures to other sources of air pollution and potential leukemogens, as well as several characteristics that could be associated with childhood ALL in our analysis, we were not able to consider other potential confounders. However, our secondary analyses for children born full term (≥37 weeks of gestation) with mothers who did not smoke during pregnancy or an SES index between 1 and 4 did not indicate substantial confounding in our ALL results. Our inability to adjust for other potential confounders, including early common infections, nutrition, family history of neoplasms, trisomy and other genetic factors, water source, and daycare attendance, as well as individual income, may have resulted in residual confounding.
Using IA-IDW well counts in the absence of information on meteorology and topography likely reduced the temporal and spatial specificity in the IA-IDW metric. However, for the monthly IA-IDW well counts we used, a monthly dominant wind direction would not be sufficient, as the Rocky Mountains create upslope and downslope winds that are dependent on local topology, the time of year, the time of day, and other local conditions, with winds regularly shifting directions throughout the day (72, 73). Temperature inversions, rather than simply wind direction, are often related to high pollution days (74). The overall effect of the resulting exposure misclassification for not accounting for these many factors is unknown.
To reduce exposure misclassification from residential mobility, we considered using reconstructed residential histories from a commercially available database. We found that we were more likely to find a record in the commercial database, an address at conception, and an address at the reference date for mothers of cases than for mothers of controls (54). We also observed that the residential address at conception and the reference date differed from the address on the birth certificate for 29% and 45% of mothers found in the database, respectively. Because these differences between cases and controls could introduce systematic bias into our analysis and our secondary analysis indicated the potential for bias (Supplementary Fig. S4), we did not incorporate the reconstructed residential histories in our analyses and assumed that the address in the birth registry represented a child’s residence over the entire exposure period (conception to latency). Another assumption inherent in using a residential history reconstruction for the child’s birth mother is that the child resides at the same address as the birth mother throughout the latency period, which is not always true (65). However, we did conduct a secondary analysis of 658 children of mothers found in the database for whom we could confirm that the mother’s residential address did not change over the exposure period. In this secondary analysis, we observed a larger measure of association (OR = 3.71; 95% CI, 1.79–7.69) in the high IA-IDW group than we observed in our main analysis (Supplementary Table S6).
Secondary analysis for children born after 1999 indicates that less precise exposure estimates prior to the year 2000 may have introduced a slight bias. Our stratified analysis by child age also indicates the possibility of increased exposure misclassification of IA-IDW in the low exposure group for longer latency periods, as evidenced by the increasing OR in the low exposure group as the child’s age increased (Supplementary Fig. S4).
Our evaluation of the pregnancy and third trimester exposure window is limited by possible differences in the time at risk for exposure between cases and controls. Differences in time at risk for exposure between cases and controls may have biased our results for the pregnancy and third trimester exposure windows.
Conclusion
This study advances understanding of the relationship between distance to, density of, and level of activity on O&G well sites and childhood ALL. It provides evidence that children living up to 13 km from O&G well site activities are at an increased risk for ALL, with children living within 5 km bearing the greatest risk. These results indicate that current regulatory setbacks between O&G well sites and residences may not be sufficient to protect the health of children living in areas of upstream O&G activities. We emphasize the pressing need to continue comprehensive and rigorous research on the health consequences of early life exposures to upstream O&G activities. Future research should address the limitations in this and previous studies and focus on populations with greater ALL risk, such as Hispanic children and specific age groups.
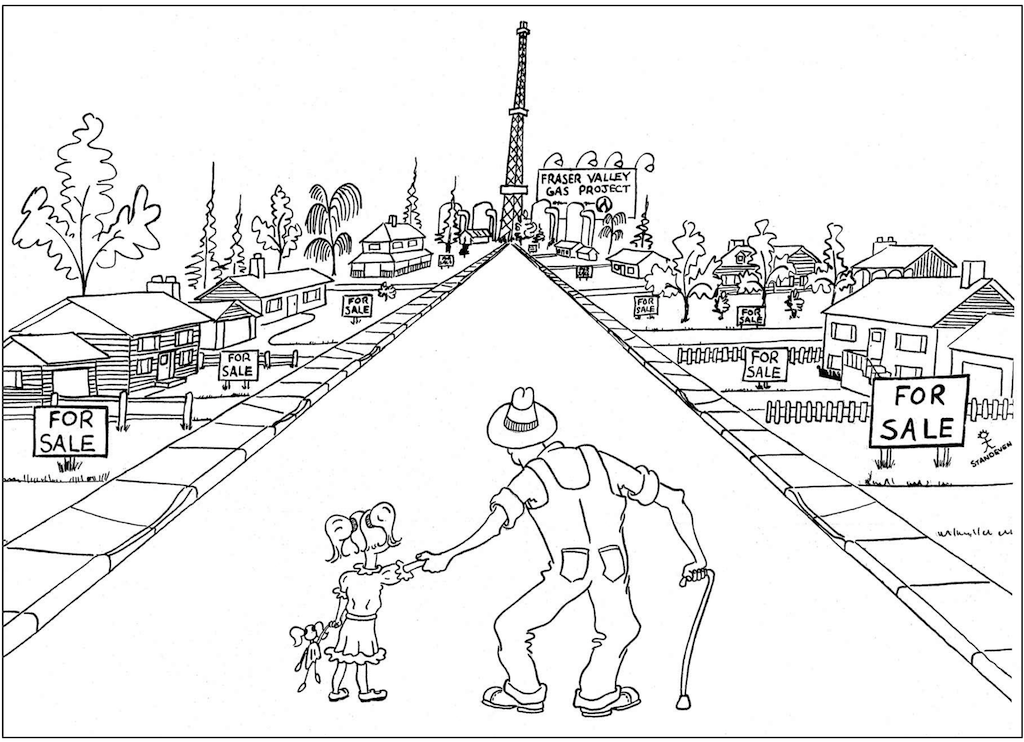
Cartoon: Fraser Valley BC gas project, when oil & gas industry moves in, homes go up for sale
Refer also to:

2014:
2013-12-12: Map of NEBC sour gas wells, oil and gas industry regulations across Canada assure that kids (and the rest of us) are in danger, with brains negatively impacted, never mind at risk of ALL and other harms. Regulators and politicians don’t give a shit about us, or our health, they just care about corporations.
2012: $250000 in community safety projects following Encana deadly sour gas leak
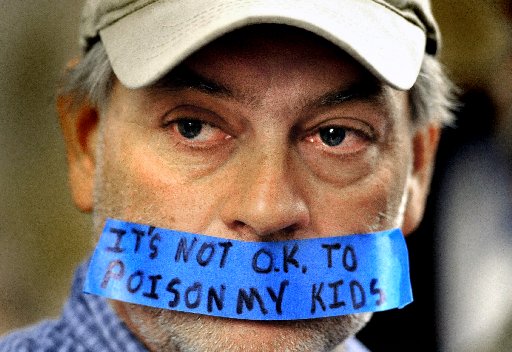
2012: Frack-Off-Cancer T-shirt worn by Alberta mom, Kimberly Mildenstein, attending county council meeting on frac harms, on cover of Mountain View Gazette

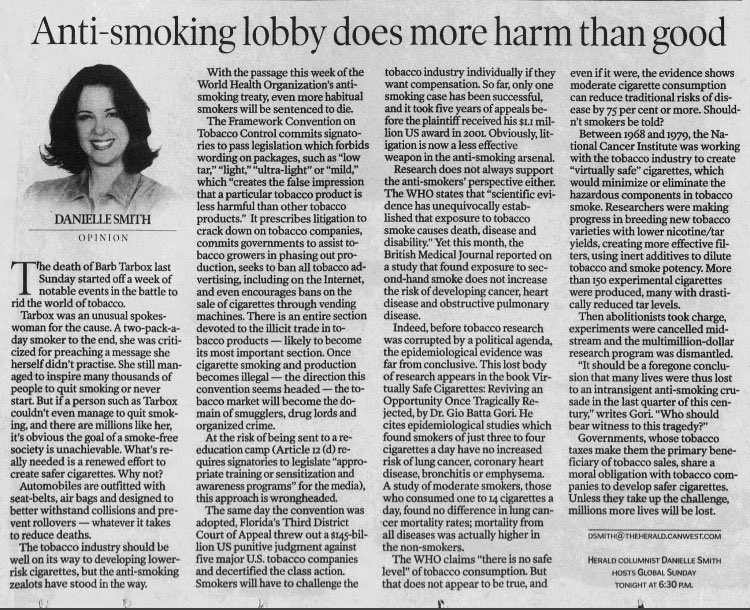
2003: Danielle Smith, Promoting Poison for us in Calgary Herald. Smoking is good; anti smoking lobby is bad! Do you think she’ll warn Albertans how toxic the oil and gas industry is?