2012: Alberta mother of three, Kimberly Mildenstein (wearing “Frack Off Cancer” T-shirt) attends Mountain View County Clr Paddy Munro’s presentation on frac’ing:

Children living near Pa. fracking sites are at increased risk of leukemia, study finds by Susan Phillips, Aug 17, 2022, State Impact
Children who live close to fracking sites in Pennsylvania have a higher risk for the most common form of childhood cancer, a new study found.
Researchers at the Yale School of Public Health used the Pennsylvania Cancer Registry, along with state data on unconventional oil and gas drill sites, to determine that children born within two kilometers, or 1.24 miles, of an active well site were two to three times more likely to be diagnosed with acute lymphoblastic leukemia between the ages of 2 and 7.
The study was published Wednesday in the journal Environmental Health Perspectives. It looked at 405 children diagnosed with that type of leukemia between 2009 and 2017, and included 2,080 controls matched by birth year.
“The magnitude of the elevated risk that we observed was fairly striking,” said Dr. Cassandra Clark, a post-doctoral fellow at the Yale School of Public Health and co-author of the report. “After accounting for a variety of socioeconomic, demographic and biological factors that could potentially be underlying this association, it was consistent.”
Acute lymphoblastic leukemia is one of the most common childhood cancers, which is why the researchers chose to look at it. Additionally, a known cause is benzene, a chemical released by oil and gas drilling activities into both air and water. The five-year survival rate in children with acute lymphoblastic leukemia is high, at 90 percent.
… More than 10,000 unconventional natural gas wells were drilled and fracked in Pennsylvania between 2002 and 2017. The Department of Environmental Protection has reported more than 1,000 spills in that period, along with fielding about 4,000 residential well water complaints between 2005 and 2014. Many who live in rural areas rely on water from private wells, about one-third of which are within two kilometers of a wellhead.
The natural gas industry maintains it operates under regulations meant to protect public health. The Marcellus Shale Coalition has said the industry’s “top priority” is protecting health and safety of workers, the environment, and people who live near fracking operations.![]() In the oil and gas industry, “meant to” usually means it won’t be done. A propagandizing lobby group promoting health and safety as a “top priority” means protection of health and safety will not happen.
In the oil and gas industry, “meant to” usually means it won’t be done. A propagandizing lobby group promoting health and safety as a “top priority” means protection of health and safety will not happen.![]()
One unique aspect of the Yale research includes tracing potential drinking water exposure.
… The interdisciplinary team of researchers included experts on leukemia and environmental science, as well as hydrogeologists. In addition to the location of well sites, researchers mapped individual watersheds and determined the flow of water from well heads to the children’s homes. They did not survey the families to determine individual sources of drinking water.
Still, they say the research shows that a child living within 1.2 miles of a well site, which is within their watershed, could be at a higher risk of exposure through drinking water.
Previous research has shown an association between fracking activities and health impacts, but determining the path to exposure is more difficult.
“I think we have about 50 epidemiological health studies demonstrating increased adverse health outcomes in communities that live near unconventional oil and gas sites,” said Dr. Nicole Deziel, a co-author of the study and associate professor at the Yale School of Public Health in the Department of Environmental Health Sciences. “I think it would be very important to understand which exposures or hazards might be driving these associations.”
Deziel says she wants the study to impact public policy, including regulations on residential setbacks from wellheads and density of drilling sites. Pennsylvania requires a 500-foot setback from schools and homes. Deziel says it should be 1,000 feet, especially since her findings show greater impacts for children exposed in utero.
Those results, she said, suggested “that that may be a sensitive time window, which is also consistent with some other studies of other environmental exposures.”
Unconventional Oil and Gas Development Exposure and Risk of Childhood Acute Lymphoblastic Leukemia: A Case–Control Study in Pennsylvania, 2009–2017 by Cassandra J. Clark, Nicholaus P. Johnson, Mario Soriano Jr, Joshua L. Warren, Keli M. Sorrentino, Nina S. Kadan-Lottick, James E. Saiers, Xiaomei Ma, and Nicole C. Deziel, August 2022, Environmental Health Perspectives
17 August 2022 CID: 087001 https://doi.org/10.1289/EHP11092
Abstract
… Results:
Children with at least one UOG well within 2km of their birth residence during the primary window had 1.98 times the odds of developing ALL in comparison with those with no UOG wells [95% confidence interval (CI): 1.06, 3.69]. Children with at least one vs. no UOG wells within 2km during the perinatal window had 2.80 times the odds of developing ALL (95% CI: 1.11, 7.05). These relationships were slightly attenuated after adjusting for maternal race and socio-economic status [odds ratio (OR) =1.74 (95% CI: 0.93, 3.27) and OR=2.35
(95% CI: 0.93, 5.95)], respectively). The ORs produced by models using the water pathway-specific metric were similar in magnitude to the aggregate metric.
Discussion:
Our study including a novel UOGD metric found UOGD to be a risk factor for childhood ALL. This work adds to mounting evidence of UOGD’s impacts on children’s health, providing additional support for limiting UOGD near residences. https://doi.org/10.1289/EHP11092
Introduction
Childhood acute lymphoblastic leukemia (ALL) is a hematological malignancy that arises from immature B- and less commonly T-lymphoid immune cells.1 ALL is the most common type of cancer in children (age 0–14 y), representing nearly 80% of childhood leukemia cases and 20%–30% of all childhood cancer cases.1–3 Incidence of ALL typically peaks in children age 2–4 y,1,4 indicating that the early life environment is likely etiologically important. Although long-term survival rates exceed 90%,5 survivors may face health and wellness difficulties later in life, such as chronic illnesses (e.g., cognitive dysfunction, heart disease),6–9 psychological issues (e.g., depression, anxiety),9–11 and elevated risk of second primary cancers.8 Despite a decrease in the incidence of cancer overall in the United States, the incidence of childhood ALL has continued to increase, underscoring the importance of primary prevention.
The etiology of ALL is likely multifactorial and attributable to both environmental exposures and underlying genetic susceptibility. Current evidence suggests that for most cases, ALL develops due to multiple genetic insults, such as chromosomal translocations or alterations.12–14 The development of preleukemic clone cells commonly occurs after an initiating genetic insult from a chromosomal translocation in utero, with an additional genetic insult required for overt ALL to manifest.2,4,14,15 Although the genetic and molecular processes behind the disease have been delineated, the upstream etiological agents triggering such biological insults remain poorly understood. Current evidence and the early age of peak ALL incidence suggest that exposure to environmental chemicals—particularly to chemicals that are hematotoxic, damage DNA, or interfere with the immune system—may provide a mechanism for pre- or postnatal insults.2,16 To date, ALL has been linked to several environmental and chemical exposures, including ionizing or diagnostic radiation,17,18 radon,19 air pollution,20–24 pesticides,25–29 polybrominated diphenyl ethers,30 and benzene.22,31–35
… Hundreds of chemicals have been reportedly used in UOGD injection water or detected in wastewater, some of which have been associated with leukemia.47 Known and suspected carcinogens include heavy metals, radioactive material, volatile organic compounds (e.g., benzene), and polycyclic aromatic hydrocarbons.48,49 In addition to water pollution, UOGD has the potential to generate air pollution during well and road construction and through vehicle emissions from the transport of oil, gas, and wastewater.50,51 Studies of UOGD-related air emissions have measured several carcinogens, including radioactivity, particulate matter (PM), and volatile organic compounds (e.g., benzene).52–55 Furthermore, elevated levels of indoor radon were measured in homes near UOGD activity.56,57 Additionally, the process of extracting natural gas also brings technologically enhanced naturally occurring radioactive compounds to the surface with ancient brine formation water, and drill cuttings and sludge from equipment may also contain radioactivity.58,59 The potential for children living near UOGD to be exposed to chemical carcinogens and radiological contaminants is a major public health concern.
Research on the potential association between exposure to UOGD and risk of childhood cancer is urgently needed. To our knowledge, there have been only two published studies of this relationship to date. The first was an ecological study conducted in the state of Pennsylvania,60 which compared standardized incidence ratios of childhood cancer before and after drilling and observed no difference; this analysis did not account for a latency period or adjust for confounders.61 The second, a registry-based case–case study in Colorado, found that children and young adults with ALL (ages 0–24 y; n=87 cases) were four times more likely to live in areas of greater oil and gas activity (conventional and unconventional combined) than controls, which were children with nonhematological cancers, based on models adjusted for multiple confounders.62 The case–case methodology may have attenuated the true association if UOGD was a shared risk factor. The paucity of data on the association between UOGD and childhood cancer outcomes has fueled public concerns about possible cancer clusters in heavily drilled regions and calls for more research and government action.63
To advance understanding of the relationship between UOGD exposure and ALL risk and inform public policy, we conducted a registry- and population-based case-control study. This work builds on prior studies by incorporating a larger sample size, the use of cancer-free controls identified from birth records, and the use of UOGD-specific metrics, including a novel metric developed for capturing exposures through the water pathway.64,65
…
Water pathway-specific metric.
Use of the water pathway-specific exposure metric in the regression models produced results that were similar to those for the aggregate metric for the primary exposure window (Figure 3). Children who had at least one upgradient UOG well within 2km had 1.94 times the odds of developing ALL (95% CI: 0.75, 4.99) in comparison with unexposed children in models adjusting only for year of birth, though the CI was wide. The association was slightly attenuated by adjusting for maternal race and WIC participation (OR=1.70; 95% CI: 0.66, 4.41), and the most adjusted model results were consistent with the parsimonious model. Children with at least one upgradient UOG well within 5km had 1.45 times the odds of developing ALL (95% CI: 0.76, 2.77). Finally, children with at least one upgradient UOG well within 10km in their watershed had 1.26 times higher odds of developing ALL than unexposed children (95% CI: 0.75, 2.14). Adjusting for maternal race and WIC participation attenuated this association (OR=1.10; 95% CI: 0.64, 1.87). The estimates produced by the sensitivity analyses were not appreciably different from those produced by the parsimonious model (Supplemental Material, “Sensitivity analysis using the highly adjusted model”). …
The ORs for the water pathway-specific metric restricted to the perinatal window were also similar to those produced by the aggregate metric (Figure 2). In models adjusting only for year of birth, children with UOG activity within 2km falling within their upgradient watershed had 3.10 times the odds of developing ALL (95% CI: 0.74, 13.01). In the parsimonious model, the odds of developing ALL for those children were 2.45 (95% CI: 0.58, 10.37). Children with an upgradient UOG well within 5 and 10km had 1.48 and 1.60 times higher odds, respectively, of developing ALL than control children (95% CI: 0.59, 3.68 and 0.83, 3.08, respectively). The odds remained elevated at 5 and 10km in the parsimonious model. Sensitivity analyses adjusting for additional covariates including sex, delivery route, birth weight, and percentage cropland did not significantly change the estimates in comparison with the parsimonious model (Supplemental Material, “Sensitivity analysis using the highly adjusted model”).
Discussion
In this population-based case–control study of UOGD including 405 children with ALL and 2,080 age-matched controls in Pennsylvania, we found that children living in proximity to UOGD had up to 2–3 times the odds of developing ALL. Although ORs were statistically significant in models only accounting for year of birth, elevated ORs persisted after additionally adjusting for race, socioeconomic status, and competing environmental exposures. However, low exposure prevalence limited our statistical power, and confidence intervals at the 2km buffer size and for the water pathway-specific metric in particular were wide. Nonetheless, our results indicate that exposure to UOGD may be an important risk factor for ALL, particularly for children exposed in utero. To our knowledge, this is the first case–control study of childhood ALL that examined UOGD exposure exclusively, the largest study of unconventional oil and gas and hematological malignancies in children, and the first study to apply a water pathway-specific metric of UOGD exposure in a health context.
Our results complement those reported by the McKenzie et al. study in Colorado, which reported significantly elevated odds of ALL for children and young adults ages 5–24 y and nonsignificantly elevated or mixed odds for children ages 0–4 y.62 In the Colorado study, the strongest odds were observed for children and young adults ages 5–24, who were 3–4 times as likely to live near UOG as control children with nonhematological cancers. Our ORs fell within a similar range. However, their study only had 39 cases in the 0–4 y age range, which may have hindered their ability to draw inferences for that group. Our results, which focus on children ages 2–7 y, provide more information on this younger age group.
Our results also suggest that preconception to birth is an important etiological window for exposure to UOG and the development of ALL. This finding is consistent with research on other environmental exposures, such as pesticides,25,26,94 bolstering the evidence for the importance of this sensitive window. ORs calculated using the perinatal window were 20%–40% larger than the estimates for the same buffer size using the primary window, though there were fewer exposed individuals and more uncertainty overall. The perinatal period is a critical window for the genetic mutations that precede the development of ALL.14,15 It is generally hypothesized that the etiology of childhood ALL is multifactorial due to two distinct genetic “hits.”95 The development of preleukemic clone cells commonly occurs after a genetic insult that results in fusion gene formation or hyperdiploidy in utero.2,95,96 Then a second, possibly postnatal, insult is required for overt ALL to develop.2,4,14,15 Given the similar results observed across both exposure windows, our findings suggest that UOG-related environmental exposures may contribute to both prenatal and postnatal insults leading to the development of ALL.
We applied a new metric for evaluating drinking water exposures from UOGD and identified suggestive relationships between IDups and ALL. This metric and our selection of buffer sizes were informed by the hydrological and epidemiological literature.64,65,76,77–81 The estimates generated using the water pathway-specific metric IDups were similar or greater in magnitude in comparison with estimates using the traditional ID2W metric, although the uncertainty associated with these estimates was higher. This finding could indicate that water is an important route of exposure to leukemogenic compounds for the development of ALL. Our metrics do not identify specific etiological agents underlying the observed associations. Seventeen compounds used or produced by UOGD have been previously associated with leukemia.47 One candidate agent is benzene. Maternal occupational and ambient exposure to benzene, which is known to be used or produced by UOGD, in the air22,32 or in the form of solvents, paints, and petroleum during pregnancy have been associated with elevated odds of ALL.35 Benzene has been detected in multiple groundwater studies in this region focused on UOGD41,65,96–99 and in biological samples from communities near oil and gas development.100 However, it is also possible that these results arose because the water pathway-specific metric produced exposure estimates similar to those of the aggregate metric, particularly when dichotomized. A previous analysis by our group showed that the continuous forms of these metrics tended to be moderately positively correlated with one another (Spearman ρ=0.62 for IDups and ID2W at 2km).65 It may be that simple proximity to UOGD, which could encompass and/or represent multiple routes of exposure, is the driving factor behind the associations for both metrics. At this time, the dominant stressor is not well understood.36 Nonetheless, epidemiological studies should try to pinpoint specific exposure pathways underlying associations. Several recent studies of UOGD have explored metrics representing specific (rather than aggregate) routes of exposure, such as flaring, earthquakes, air pollution, and radioactivity.50,55,101–103
Epidemiological studies of UOGD exposure have generally relied on spatial surrogates of exposure, such as ID2W well counts. Previous epidemiological studies using spatial metrics have mainly used a 10km buffer size or larger.104,105 However, when considering environmental exposures like water pollution, realistic transport distances should be considered.106 A study in northeast Pennsylvania measuring the vulnerability of groundwater wells to contamination by UOGD indicates that the extent of a domestic groundwater well’s capture zone (the area around the well from which the water is pulled) is generally less than 2km.77 Further, Llewellyn et al. suggested that a contaminant plume migrated 1 to 3km in groundwater from a well pad to domestic wells,79 and the results of Osborn et al. and Jackson et al. suggest elevated methane levels (i.e., enhanced gas phase transport) within 1km of UOG well pads.107,108 Beyond water, an analysis of UOG-related air pollutants found that individuals whose closest UOG well was <0.5 mi (0.80km) were at greater risk of health effects from exposure to air pollutants than those further than 0.5 mi from a well.53 The extent of transport of UOG-related air pollutants would be expected to vary by pollutant and local meteorology. Because emitted pollutants attenuate at different functions of distance, there may not be a universal buffer size that optimally captures all hazards. It is possible that applying buffer sizes of 10km or more could introduce exposure misclassification, dilute the pool of meaningfully exposed individuals, and thus attenuate the magnitude of the observed effect. In this analysis, we observed the largest effect sizes using a buffer size of 2km, though the number of exposed individuals in these groups was low. The magnitude of the effects at the 5 and 10km buffer sizes were comparably moderate and was likely particularly apparent in our study because the metrics were used in a binary fashion. Spatial metrics are more typically categorized (e.g., quartiles), and our restricted exposure distribution precluded use of this method. Nonetheless, this attenuation of the observed effect based on the buffer size considered may provide support for using smaller, more selective buffer sizes in epidemiological analyses despite effects to sample size.
This work adds to a growing body of literature on UOGD exposure and women’s and children’s health used to inform policy, such as setback distances (the required minimum distance between a private residence or other sensitive location and a UOG well).109,110 Current setback distances in the United States are the subject of much debate,111,112 with some calling for setback distances to be lengthened to more than 305m (1,000 ft)113,114 and as far as 1,000m (3,281 ft).115 The current setback distance in Pennsylvania is 152m (500 ft), extended from 61m (200 ft) in 2012.116 We observed elevated odds of cancer associated with UOG activity within 2km, which exceeds any existing setback distance. Further, although effect sizes diminished with increasing buffer size, the odds of ALL were still elevated at 5 and 10km buffer sizes. Our results in the context of the broader environmental and epidemiological literature suggest that existing setback distances are insufficiently protective of public health, particularly for vulnerable populations like children, and should be revisited and informed by more recent data.
Our study has several notable strengths. It is the largest study to date investigating UOGD with ALL or any childhood cancer, the first case–control study to focus exclusively on UOGD exposure, and the first to apply a water pathway-specific UOGD exposure metric. We controlled for multiple known risk factors and examined the impact of several competing environmental exposures. We assessed UOGD exposure at multiple buffer sizes informed by the epidemiological and environmental literature. Selection bias, a typical concern in case–control studies, is unlikely to have affected our study because we selected cases from population-based cancer registries and controls from statewide birth records without the need to contact any subjects and seek consent for participation. Because we had access to addresses at two time points for the cases, we were able to examine the potential impact of residential mobility on exposure classification. We determined that only a very small percentage of cases (<2%) had different exposure assignments across birth address and diagnosis address, indicating limited potential for exposure misclassification. This finding is consistent with that of other studies of spatially defined environmental exposures, which also have not found residential mobility to be a major source of error.82,83
Our study had several limitations. First, we were constrained by individual-level information available in the birth records, which limited our ability to investigate potential confounders such as parental occupation. Though we designed a statewide study, UOGD is confined to the extent of the shale and drilling is also not performed in urbanized metropolitan centers. Therefore, most of our study population was unexposed. However, we would expect this to have attenuated any observed relationships, because population density and incidence for cancer with nonmodifiable risk factors tends to be higher in urban areas,117 and urban dwelling individuals may be more likely to experience known risk factors for ALL, such as air pollution.118,119 Although the ORs were not statistically significant after adjusting for race, socioeconomic status, and other environmental exposures in comparison with ORs from models accounting for year of birth alone, the odds remained consistently elevated across different time periods and metrics. ALL is a rare disease, and as such, the lack of statistical significance could be due more to the rarity of the disease limiting our precision than to lack of biological or public health significance. Low exposure prevalence (between 1% and 5%) when using the water pathway-specific metric (particularly at the smaller buffer sizes) may have reduced model stability and reduced the overall precision of risk estimates. This metric may reveal more differences in larger study populations, or in studies of more common health end points. Moreover, the metric is most relevant for people using private groundwater wells. Although a significant proportion of our suburban and urban population may be served by public water sources, up to 50% of residents in the more heavily drilled rural counties may be served by groundwater wells.120,121 There is an opportunity to further examine drinking water sources in this population to improve the accuracy of exposure assessment.
Our study suggests that children living near UOGD have increased odds of developing ALL as assessed by multiple metrics, including a novel metric representing drinking water exposure. The magnitude of the association was greatest among those children living within 2km of UOGD and exposed during the perinatal period. This research adds to a growing body of work documenting adverse health effects associated with UOGD, particularly among children,36,109,110 and provides additional support for more stringent setback policies and other public health measures to reduce exposures to UOGD.

Refer also to:
2021: Oooo la la! Spain bans frac’ing Nationwide
2021: How “law makers” put polluting corporations above the law.
2021: Barbara Wendeborn Brandom, MD: “There is no safe way to frack gas.”
2021: Air pollution and COVID-19: A dangerous combination.
2021: Study: Increased cancer risk for oil patch workers and neighbours
2019: Suffering and living in fear in Frackville, Pennsylvania; More Ewing sarcoma research is needed

Imagine by FrackingCanada
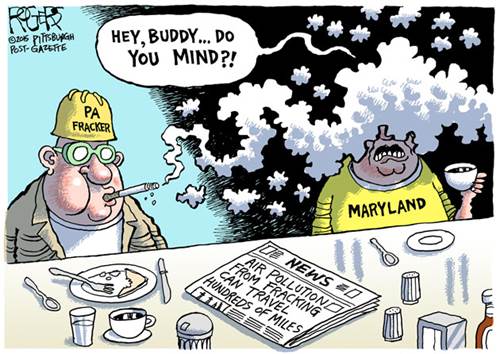
2015: Fracing’s long reach: New Study says Fracking Wells Could Pollute The Air Hundreds Of Miles Away
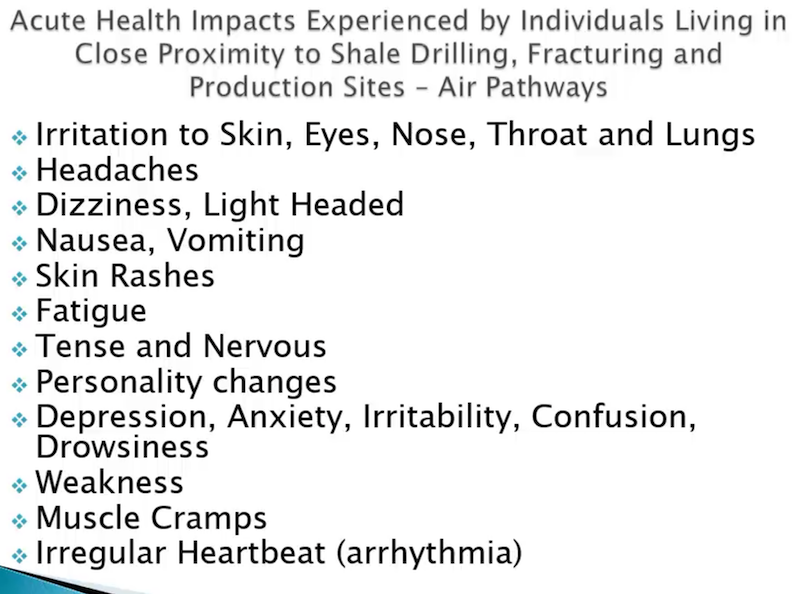
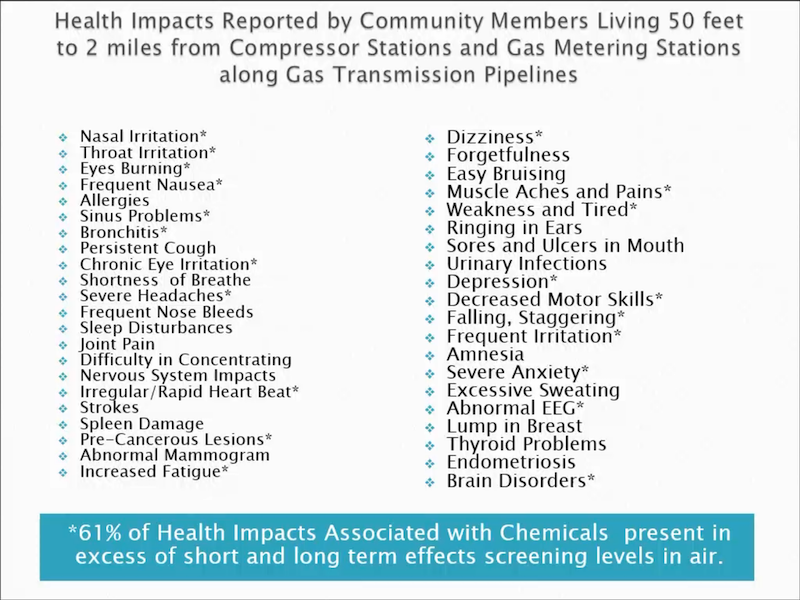
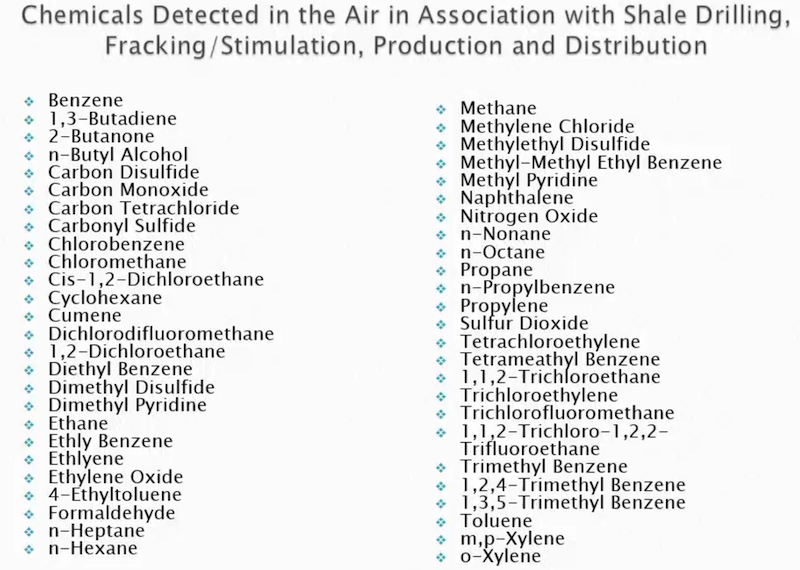
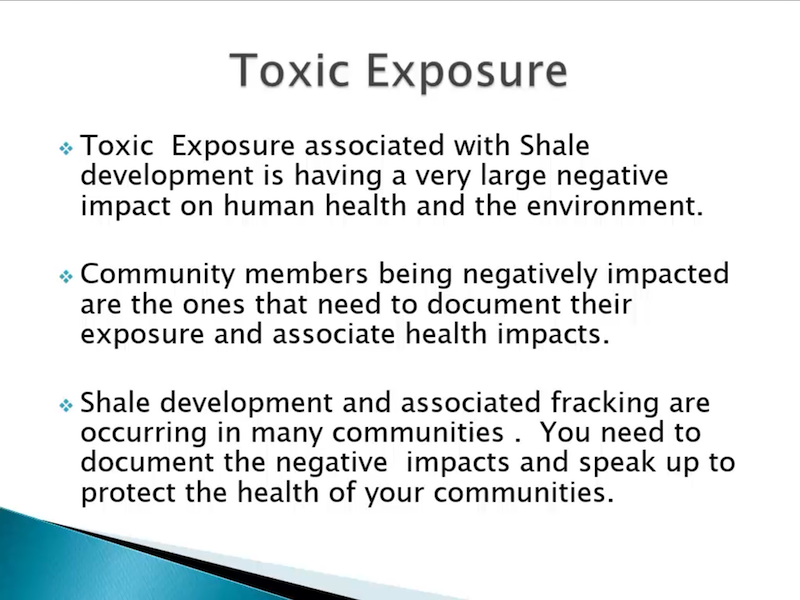
2015: A few slides from Wilma Subra MS – Ethane crackers, the Louisiana experience, shale and public health issues:
![]() After living 21 years frac’d, I suffer from many of the health impacts listed above and below (I didn’t before I got frac’d):
After living 21 years frac’d, I suffer from many of the health impacts listed above and below (I didn’t before I got frac’d):![]()
2014: Hydraulic fracturing letter by Robert Griebel, Alberta MD: Reckless pollution of our environment
2014: Diana Daunheimer’s frac lawsuit follows years of policing industry in her own backyard
2012: Instead of regulating law violating frac’ers, ERCB regulates the harmed, sends RCMP to charge mom trying to protect three sons Kimberly Mildenstein of Eagle Hill Alberta Spared Criminal Record for Uttering Threats after Numerous Concerns to the Energy Resources Conservation Board (ERCB) Were Ignored
2012: Why was a 2012 Health Canada Report, admitting significant health hazards and risks to groundwater and air from hydraulic fracturing, kept from the public? Ten years later, Health Canada has still not released their report to Canadians.
2012: Air emissions near natural gas drilling sites may contribute to health problems
2012: Pollutants linked to ‘fracking’ found in Pavillion Wyoming groundwater ![]() Just another Encana/Ovintiv frac-a-community’s-aquifers shit show
Just another Encana/Ovintiv frac-a-community’s-aquifers shit show![]() Diesel in Pavillion Wyoming Water Near Fracking Confirms EPA Tests
Diesel in Pavillion Wyoming Water Near Fracking Confirms EPA Tests
2011:

2010: Natural Gas Operations from a Public Health Perspective
For many years, drillers have insisted that they do not use toxic chemicals to drill for gas, only guar gum, mud, and sand. While much attention is being given to chemicals used during fracking, our findings indicate that drilling chemicals can be equally, if not more dangerous.
Imagine by FrackingCanada
2006 Testing by Alberta Environment:
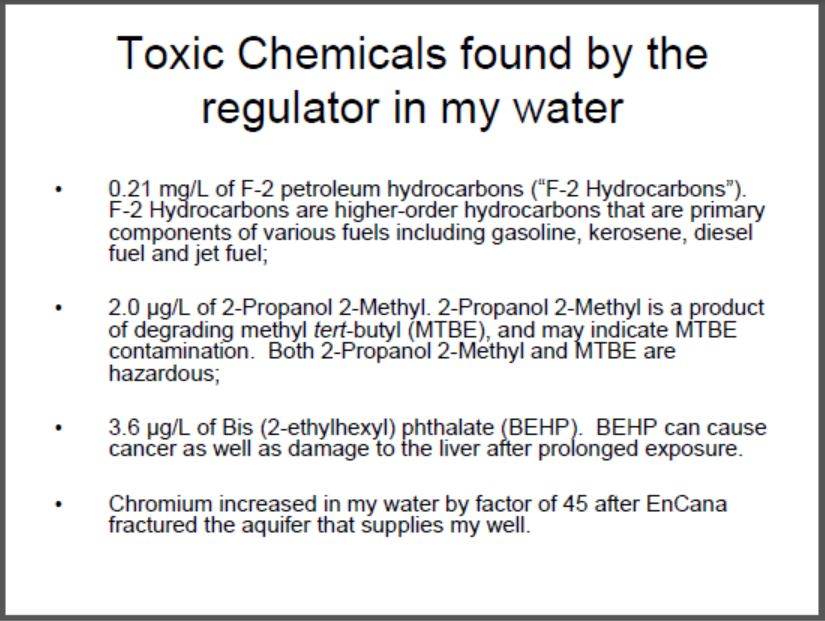
As expected at the time, Encana/Ovintiv lied. I still do not have safe alternate water after Encana illegally frac’d the aquifers that supply my drinking water well.
2005: Instead of policing unlawful aquifer frac’er Encana/Ovintiv, Alberta’s energy regulator, the AER, (then EUB, then changed to ERCB after it was caught breaking the law, and spying on innocent Albertans), polices the harmed and further harms us. The energy regulator violated my Charter rights – in writing no less and copied Alberta’s AG and the RCMP – trying to terrify me silent.
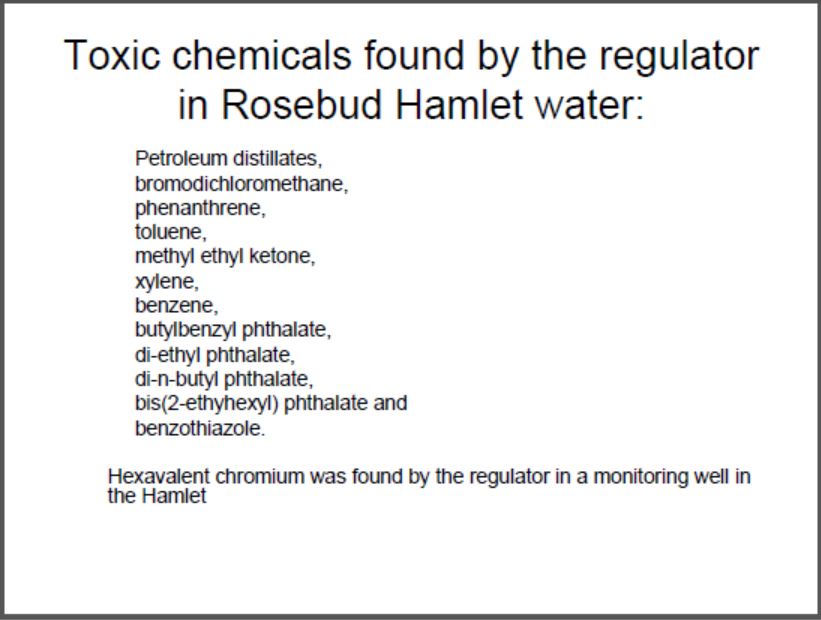
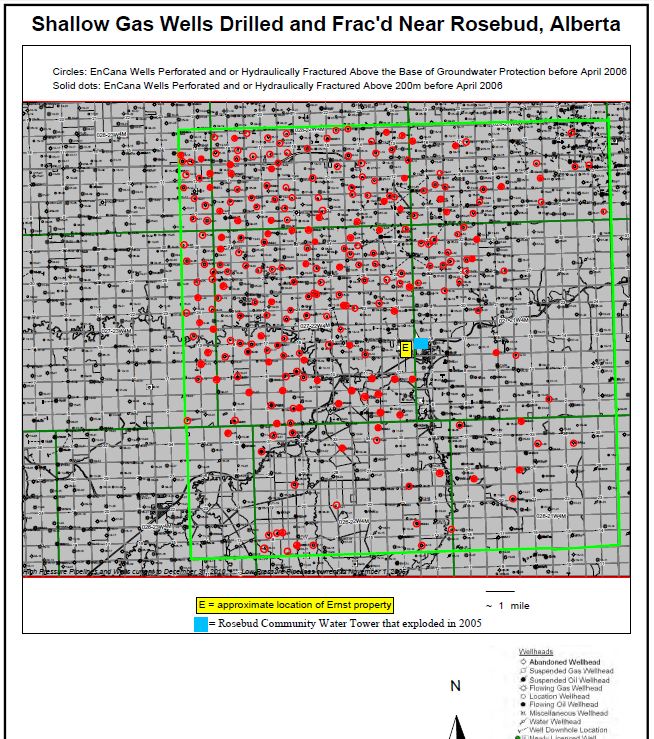
2004 & 2001: Encana/Ovintiv illegally frac’s directly and repeatedly into Rosebud’s drinking water aquifers.
1981:
1971: Demise of humanity begins: Alberta gov’t creates the ERCB to guard the ‘Oil patch Mafia’