Putting a value on injuries to natural assets: The BP oil spill by Richard C. Bishop, Kevin J. Boyle, Richard T. Carson, David Chapman, W. Michael Hanemann, Barbara Kanninen, Raymond J. Kopp, Jon A. Krosnick, John List, Norman Meade, Robert Paterson, Stanley Presser, V. Kerry Smith, Roger Tourangeau, Michael Welsh, Jeffrey M. Wooldridge, Matthew DeBell, Colleen Donovan, Matthew Konopka and Nora Scherer, Science 21 Apr 2017: Vol. 356, Issue 6335, pp. 253-254, DOI: 10.1126/science.aam8124
When large-scale accidents cause catastrophic damage to natural or cultural resources, government and industry are faced with the challenge of assessing the extent of damages and the magnitude of restoration that is warranted. Although market transactions for privately owned assets provide information about how valuable they are to the people involved, the public services of natural assets are not exchanged on markets; thus, efforts to learn about people’s values involve either untestable assumptions about how other things people do relate to these services or empirical estimates based on responses to stated-preference surveys. Valuation based on such surveys has been criticized because the respondents are not engaged in real transactions. Our research in the aftermath of the 2010 BP Deepwater Horizon oil spill addresses these criticisms using the first, nationally representative, stated-preference survey that tests whether responses are consistent with rational economic choices that are expected with real transactions.
Our results confirm that the survey findings are consistent with economic decisions and would support investing at least $17.2 billion to prevent such injuries in the future to the Gulf of Mexico’s natural resources.
The federal judge in an initial phase of the lawsuit involving BP determined that the best estimate of the amount of oil released was 134 million gallons, making it the largest maritime oil spill in U.S. history. On behalf of the trustees of the Gulf’s natural resources and under the guidance of the lead agency for this process, the U.S. National Oceanic and Atmospheric Administration (NOAA), we estimated the monetary value of the natural resource damage from the spill, as specified by the Oil Pollution Act (OPA) of 1990. Such estimates can inform settlement negotiations between the government and the responsible parties, be entered as evidence at trial, and contribute to choosing projects to restore injured environmental resources (1). Trustees undertook a number of studies to quantify ecological impacts and economic damages caused by the spill, including what we describe here.
The natural resource–damage case was settled in April 2016. The Consent Decree called for total payments of $20.8 billion, $8.8 billion of which was for natural resource damages. Decisions related to the settlement details are confidential.
Economic measures of the damages to natural resources consider the effects on use (or active use) and nonuse (or passive use) values (2). “Use values” arise when an individual derives satisfaction from using a resource (e.g., fishing or visiting a beach), either now or in the future. “Nonuse values” arise when an individual derives satisfaction from the existence of a resource, even though that individual would not visit or use it. The OPA regulation specifies that damage measures include both use and nonuse or the total economic value lost. Private claims by those engaged in commercial fishing or in operating hotels are handled separately.
After the 1989 Exxon Valdez oil spill and controversy over assessing monetary damages with stated-preference surveys, an expert panel (3) recommended criteria for conducting these studies. Research has since established ways to ask stated-choice questions that induce truthful responses and meet these proposed criteria. Subsequent criticism of stated-preference research has focused on how large the change in the average person’s value should be with changes in the size of injuries to natural resources. The research we discuss here identified what can be expected on the basis of a conventional economic model of an individual’s choices, with minimal assumptions. It also offers evidence that the average individual’s likelihood to vote for a program to avoid injuries is causally linked to a consistent understanding of the severity of the injuries.
Survey Design and Implementation
The study interviewed a large random sample of American adults who were told about (i) the state of the Gulf before the 2010 accident; (ii) what caused the accident; (iii) injuries to Gulf natural resources due to the spill; (iv) a proposed program for preventing a similar accident in the future; and (v) how much their household would pay in extra taxes if the program were implemented. The program can be seen as insurance, at a specified cost, that is completely effective against a specific set of future, spill-related injuries, with respondents told that another spill will take place in the next 15 years. They were then asked to vote for or against the program, which would impose a one-time tax on their household. Each respondent was randomly assigned to one of five different tax amounts: $15, $65, $135, $265, and $435 [see supplementary materials (SM) for further information, including details on survey methods and questionnaires (4) and survey data (5)].
Study design began shortly after the accident and was contemporaneous with the injury assessment by natural scientists. This survey design process, which spanned >3 years of development, testing, and refinement (see SM), was intended to ensure that respondents had information to make an informed choice about the oil spill prevention program; the program was seen as plausible and effective; the text and graphics were clear; and the information was presented in a way that encouraged respondents to base decisions about the program on the importance of preventing the specified injuries and on the amount of money they would pay in additional taxes.
The final questionnaire was administered to a random sample of households in the contiguous United States that included at least one English-speaking adult. Face-to-face interviews were completed between October 2013 and July 2014 by nearly 150 trained interviewers. A total of 3656 people completed the survey for a weighted response rate of 48%. A nonresponse followup (NRFU) survey involved mailing paper questionnaires to households at which no main study interview had been completed. NRFU questionnaires were received from 1492 households, representing a NRFU household response rate of 51% (see SM for details of weighting and nonresponse).
Economic Value, Tests of Consistency
When a respondent to a stated-preference survey believes her answer will be consequential and is given a single binary referendum question, her best strategy is to answer truthfully whenever the payment mechanism is coercive, like a tax. Consequential, in this context, means respondents care about the outcome of the program decision and believe both that there is a nonzero probability that the survey choices will influence the decision about the program and that they will have to pay the tax amount described to them (6, 7).
Several steps were taken to ensure that respondents saw their votes as consequential. A letter on official U.S. Department of Commerce (in which NOAA is based) letterhead was sent to each sampled address before the interview, emphasizing the importance of the study for policy-making. Interviewers reviewed the content of the letter with respondents before administering the survey. The questionnaire explained that implementing the program, a decision that had not yet been made, would require new tax revenue.
The questionnaire described the state of the Gulf ‘s affected resources before the spill, the effect of the spill on each resource, and the time required for each to return to its prespill condition. To test for sensitivity to the scope of the injury, respondents were randomly assigned to different versions of the questionnaire, describing different sets of injuries and different tax amounts for the prevention program. The smaller set of injuries described the number of miles of oiled marshes, of dead birds, and of lost recreation trips that were known to have occurred early in the assessment process. The larger set included the injuries in the smaller set plus injuries to bottlenose dolphins, deep-water corals, snails, young fish, and young sea turtles that became known as later injury studies were completed [see preassessment and assessment components of (4)]. Randomization of the questionnaire versions produces statistically equivalent subsamples of individuals for each combination of tax amount and injury description.
It is not possible to directly observe each household’s willingness to pay (WTP, the largest amount a household would pay). Rather, once a respondent is presented with the tax amount and asked to vote on the prevention program, the vote is observed. When a respondent votes for the program, this decision implies that her WTP is not less than the tax amount. A no vote implies it is less. These votes are used to estimate a lower bound for the average WTP (8–10).
With take-it-or-leave-it choices, such as voting, economic theory suggests two key empirical tests for consistent decisions [see Technical Memo TM-3 in (4)]. First, for a specific injury description, the proportion of individuals voting for the program should not increase as the tax amount increases. Second, for a given tax amount, a program that avoids more injuries should be preferred over one that prevents fewer injuries (unless the individual is not concerned about services provided by the Gulf’s resources). Both tests were satisfied (see the table) and were supported by formal statistical tests [see TM-10 in (4)]. The voting responses are correlated with covariates, including respondents’ beliefs in the likelihood of a future spill and in the effectiveness of the program and their attitudinal and demographic characteristics, such as identifying oneself as an environmentalist and household income [see TM-9 in (4)].

Injury descriptions, tax amounts influence program support
For each injury description, support for the program declines as the tax increases, consistent with the first test for consistent decisions. For each tax amount, support for the program increases as the set of injuries increases, consistent with the second test.
The estimate for the lower-bound mean WTP for the smaller set of injuries is $136 (standard error $6.34) and for the larger set is $153 (standard error $6.87). The aggregate estimate reported at the outset—$17.2 billion—uses the WTP lower-bound estimate for the larger set of injuries ($153) multiplied by the number of households (112,647,215) represented by the sample.
The Road Ahead
Under the OPA, restoration activities are intended to ensure that the injured resources and the public that values them are made whole. Estimates for what U.S. households would pay to avoid injuries from another spill like those in 2010 offer one way to scale the extent of restoration. This is important because ecosystems are dynamic and after a major shock, it is difficult to define and implement reliable strategies that would return these systems to their previous condition (11, 12). Thus, it is reasonable to ask whether resources devoted to such enhancements are worth the cost. Measures of the economic value of avoiding the original injury help address this question.
This study also establishes that surveys developed by using state-of-the-art design and implementation procedures that present a credible program to evaluate, with an incentive-compatible choice question, allow tests for economically consistent decisions and measures of the trade-offs that people would make to protect environmental resources from injuries.
[Refer also to:
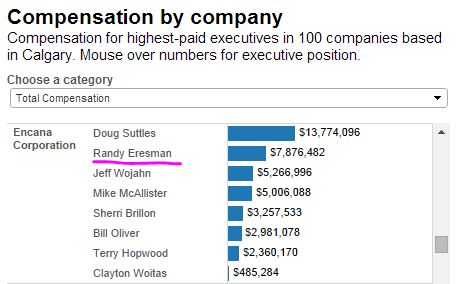
Encana’s previous CEO Randy Eresman also engaged in shady “best” practices: