@ryankatzrosene:
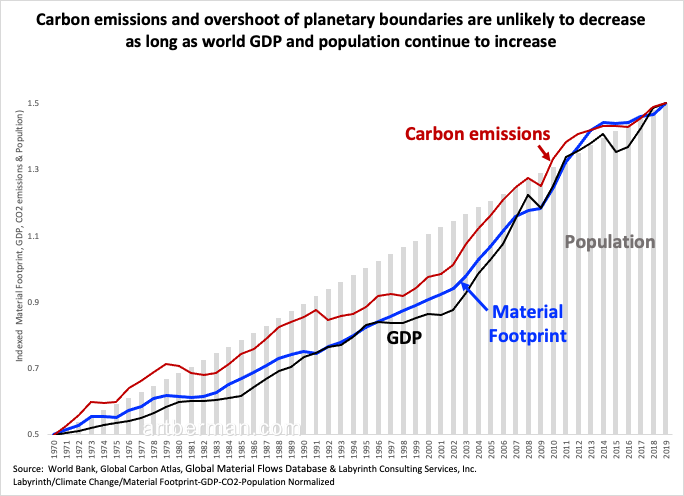
Sheesh… Canadian GHG emissions reductions are slow [as fuck]
@KarolusWangus:
I feel like the wildfires are distorting that, no?
@ryankatzrosene:
Nope, this doesn’t include wildfire emissions.
***
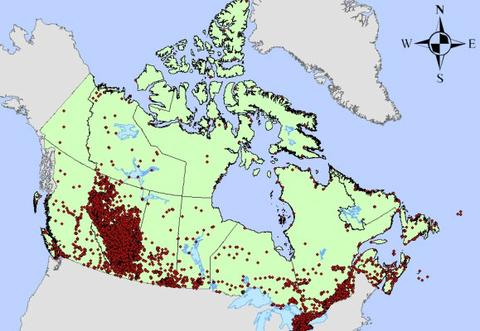
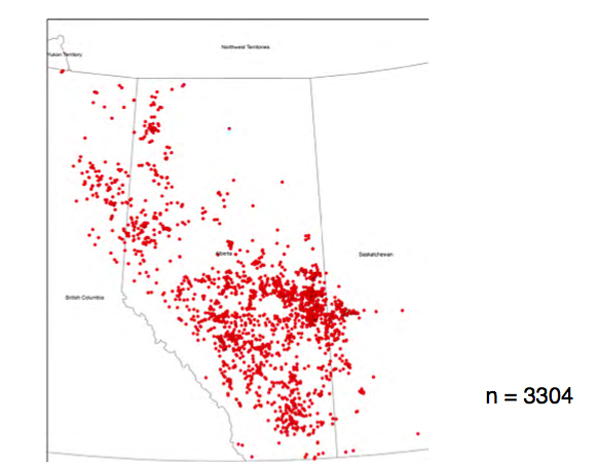
2012: Map of oil and gas wells needing clean-up and likely leaking, many more since:
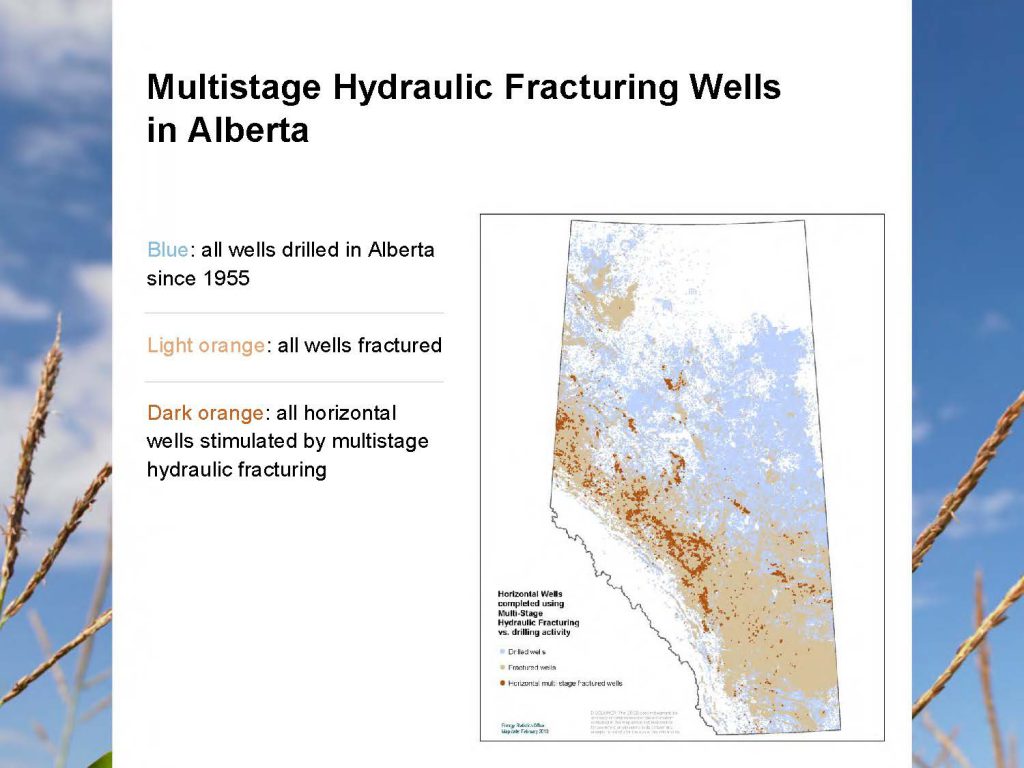
2013: Map of all wells drilled in Alberta (in blue) and all wells frac’d (light and dark orange):
2014 Map of Alberta’s methane/ethane leaking oil and gas wells (many more since)
Inequality is driving the climate crisis: A longitudinal analysis of province-level carbon emissions in Canada, 1997–2020 by Andrew Jorgenson, Taekyeong Goh, Ryan Thombs, Yasmin Koop-Monteiro, Mark Shakespear, Grace Gletsu, and Nicolas Viens, Energy Research & Social Science, Volume 119, January 2025, 103845, Science Direct
https://doi.org/10.1016/j.erss.2024.103845
Abstract
The authors conduct a comprehensive analysis of the relationship between carbon emissions and income inequality for the Canadian provinces for the 1997 to 2020 period. The results indicate that the short-run and long-run effects of the income share of the top 10 % and the top 5 % on province-level emissions are positive, robust to various model specifications, net of multiple demographic and economic factors, not sensitive to exogenous shocks or outlier cases, symmetrical, statistically equivalent for emissions from different sectors, and their short-term effects do not vary in magnitude through time. The findings also consistently show that the estimated effect of the Gini coefficient on province-level emissions is not statistically significant. Overall, the results underscore the importance in modeling the effects of income inequality measures that quantify different characteristics of income distributions, and they are very consistent with analytical approaches regarding power concentration, overconsumption, and status competition that suggest that a higher concentration of income leads to growth in anthropogenic carbon emissions.
1. Introduction
Income inequality is a topic of substantial and growing interest within scientific research on the anthropogenic drivers of climate change [[1], [2], [3], [4], [5]]. Many studies focus on how carbon dioxide (CO2) emissions is associated with income inequality in global, national, and sub-national contexts [[6], [7], [8], [9], [10], [11], [12], [13], [14], [15], [16], [17], [18], [19], [20], [21], [22]]. The inclusion of and engagement with this research in synthesis and policy documents, such as the IPCC assessment reports and national climate assessments, has also grown in recent years [23,24]. This inclusion and engagement is perhaps not surprising, given that income inequality is found in many studies to be associated with anthropogenic emissions, which highlights the necessity for equity considerations when addressing both the societal causes and consequences of the climate crisis [10,[25], [26], [27], [28], [29], [30], [31]].
We add to this important area of climate change research by focusing on the relationship between CO2 emissions and income inequality in Canada, which is one of the world’s largest emitters, ranking tenth in the year 2020 for territorial CO2 emissions [32] and eleventh for consumption-based (i.e., adjusted for trade) CO2 emissions [33]. Using a range of statistical modeling techniques, we conduct an analysis of the effects of inequality on emissions for the Canadian provinces for the 1997 to 2020 period. While other recent research investigates the relationship between carbon emissions and income inequality for Canada as a whole [34], to our knowledge, the present study is the first to analyze this relationship in a longitudinal, Canadian cross-province context. Without question, Canada’s economy is energy-intensive and the nation is among the world’s greatest carbon polluters. We suggest a focus on province-level emissions is critical, given the power provinces have in regulating emissions and implementing measures that could reduce inequality. We consider multiple measures of income inequality, including the income share of the top 10 %, income share of the top 5 %, and the Gini coefficient. The inclusion of the three inequality measures is important on both measurement and substantive grounds: they capture different characteristics of income distributions and are therefore well suited to empirically evaluate the arguments of different analytical approaches.
One analytical approach suggests that a higher concentration of income is likely to be associated with higher levels and growth in anthropogenic CO2 emissions and other forms of pollution. Those in the top of the income distribution are more likely to be owners of carbon-polluting firms, be major investors in carbon-intensive sectors, serve on the boards of firms and corporations, consume more goods and services with substantial environmental impacts, live in larger spaces and own multiple homes, and participate much more frequently in expensive carbon-intensive activities, such as air travel [14,17,35]. They are also likely to utilize their economic resources to gain disproportionate influence in climate, energy, and other areas of environmental policy, as they benefit financially from carbon-polluting economic activities [[36], [37], [38], [39], [40], [41], [42]]. A second approach argues that a higher concentration of income causes enhanced status competition, leading to increased CO2 emissions. Middle- and low-income households increase their spending to emulate the highly visible and culturally desirable carbon-intensive lifestyles of high-income individuals and households [43]. This is referred to as both the “Veblen effect” [44,45] and the “influencer effect” [17], and is amplified when there is a greater concentration of income and wealth [46,47]. Many researchers consider concentration measures, such as the income share of the top 10 % and the top 5 %, to be ideal for empirically evaluating the propositions of these two approaches, with multiple studies finding empirical support for them [1,13,16,34,47].
A third analytical approach suggests that CO2 emissions are negatively associated with income inequality since the marginal propensity to emit decreases as household income increases [[48], [49], [50]]. Each additional dollar of household income will lead to a larger marginal increase in emissions in low-income households compared to middle-income households, and in middle-income households compared to high-income households. A fourth approach, influenced by Keynesian thinking, argues that the marginal propensity to consume declines with increases in household income, and therefore, a top-to-bottom redistribution of income, which reduces income inequality, could increase overall consumption and CO2 emissions [16]. Given how it measures inequality within distributions, the Gini coefficient is often considered the more appropriate income inequality measure for testing the arguments of these two approaches, with prior research yielding inconsistent findings [20,[51], [52], [53], [54]].
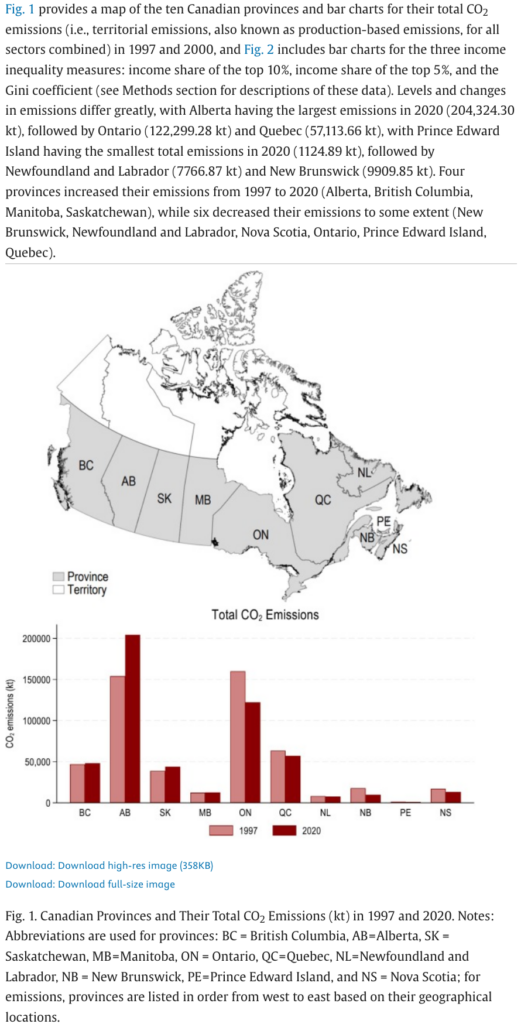
Fig. 1 provides a map of the ten Canadian provinces and bar charts for their total CO2 emissions (i.e., territorial emissions, also known as production-based emissions, for all sectors combined) in 1997 and 2000, and Fig. 2 includes bar charts for the three income inequality measures: income share of the top 10 %, income share of the top 5 %, and the Gini coefficient (see Methods section for descriptions of these data). Levels and changes in emissions differ greatly, with Alberta having the largest emissions in 2020 (204,324.30 kt), followed by Ontario (122,299.28 kt) and Quebec (57,113.66 kt), with Prince Edward Island having the smallest total emissions in 2020 (1124.89 kt), followed by Newfoundland and Labrador (7766.87 kt) and New Brunswick (9909.85 kt). Four provinces increased their emissions from 1997 to 2020 (Alberta, British Columbia, Manitoba, Saskatchewan), while six decreased their emissions to some extent (New Brunswick, Newfoundland and Labrador, Nova Scotia, Ontario, Prince Edward Island, Quebec).
…
4. Conclusion
Income inequality is a topic of substantial and growing interest in research on the climate crisis in general, and in the anthropogenic drivers of emissions literature in particular [[1], [2], [3], [4],7,73]. Our analysis contributes to this body of interdisciplinary research by focusing on the relationship between CO2 emissions and multiple measures of income inequality in Canada’s provinces for the 1997 to 2020 period. To the best of our knowledge, this is the first study to analyze these relationships in a longitudinal, Canadian cross-province context.
The Canadian context has global and nontrivial implications, given that Canada is among the world’s nations with the highest overall emissions, and Fig. 1 and Fig. 2 highlight the notable differences in emissions and inequality between and within provinces through time.
The results of the statistical analysis indicate that the short-run and long-run effects of income share of the top 10 % and the top 5 % on province-level CO2 emissions are positive, robust to various model specifications, net of multiple demographic and economic factors, not sensitive to exogenous shocks such as initial Covid pandemic effects, not sensitive to the inclusion of the province with the highest levels of emissions and income concentration, symmetrical, statistically equivalent for energy and non-energy emissions, and their short-run effects do not vary in magnitude through time. The findings also consistently show that the estimated effect of the Gini coefficient on province-level emissions is not statistically significant. Overall, the results underscore the importance in modeling the effects of income inequality measures that quantify different characteristics of income distributions, and they are very consistent with the analytical approaches that suggest that a higher concentration of income is likely to be associated with growth in anthropogenic CO2 emissions [13,14,16,17,[36], [37], [38], [39], [40], [41],43,46,47].
From a climate mitigation perspective, the findings underscore the necessity for Canada’s provinces to seriously address the role of income inequality, since a high concentration of income towards the top of the distribution appears to be a notable driver of their anthropogenic emissions through time. Based on Model 3 in Table 1 (see also Fig. 3), and using the emissions data included in the reported analysis (see also Fig. 1 and Fig. 2), a 1 % increase in the income share of the top 10 % in the year 2020 would lead to a short-run increase in CO2 emissions for the provinces combined of 885.124 kt, and a long-run increase in their combined emissions of 3504.05 kt. Regarding the other income concentration measure, based on Model 3 in Table 2 (see also Supplementary Fig. 1), a 1 % increase in the income share of the top 5 % in the year 2020 would lead to a short-run increase in the provinces’ combined CO2 emissions of 708.099 kt, and a long-run increase in their combined emissions of 2931.323 kt. Since the analysis also indicates that the short-run and long-run effects of the income concentration measures are statistically symmetrical, it is reasonable to suggest that decreasing these forms of income inequality could lead to substantial reductions in province-level emissions.
While this study makes distinct and significant contributions, it also has limitations that should be addressed in future research. First, while the findings are consistent with analytical approaches that hypothesize that a higher concentration of income is associated with growth in CO2 emissions, the reported analysis, based on current data availability, do not include measures that fully capture the underlying mechanisms tied to power, overconsumption, and status competition that are proposed to shape the emissions and inequality relationship. We hope to address this limitation in future research, as doing so has implications for climate mitigation action and policy, as well as for more nuanced hypothesis testing and theory refinement. Second, due to current data availability, the reported analysis covers the 1997 to 2020 period. Future research would do well to also include years post 2020 to assess if the effects of income inequality on province-level emissions remained consistent or shifted in magnitude in more recent years. Third, while the analysis focuses on provinces, it overlooks potential variation between smaller geographic units within provinces. Future research, data permitting, would do well to assess the effects of income inequality on emissions within Canada at even smaller scales. Fourth, while we find that none of the economic sector measures suppress the estimated effects of the income concentration measures, nor do they exert significant effects on carbon emissions themselves, future research should consider if the structure of economic sectors and industries shape income inequality within and across provinces, as well as if economic elites in some provinces have benefited from fossil capitalism in ways that shape their political power and the overall relationship between emissions and inequality [74]. Fifth, future research should also assess the effects of income inequality on province’s consumption-based (i.e., adjusted for trade) emissions, if and when such data become available. Finally, it is unclear if the findings are widely generalizable outside of Canada. While prior longitudinal research yields similar results for U.S. states [16], future research would do well to conduct similar analysis in other sub-national contexts.
![]()
Refer also to:
Spooky Vampire Zombie Climate Canaries!!! 1:49 Min. by Climate Casino, Sept 15, 2024
Meh Pluribus Unum @pluribus-unum.co:
Fellow Americans,
If this is upsetting to you, please stop buying/using things like RoundUp.
Tim Hill (blocks ad hominem). @tjrh.uk:
Neocotinoid insecticides kill pests. Bees are insects so it kills them too. Both the chemical and farming industries are lying when they claim these poisons are safe.
@sean.carolan.io:
someday you can tell your grandkids all about fruits and nuts while they eat their corn porridge
Almonds
Apples
Blueberries
Cherries
Cucumbers
Melons
Pumpkins
Squash
Cranberries
Avocados
Bananas

@ryankatzrosene:
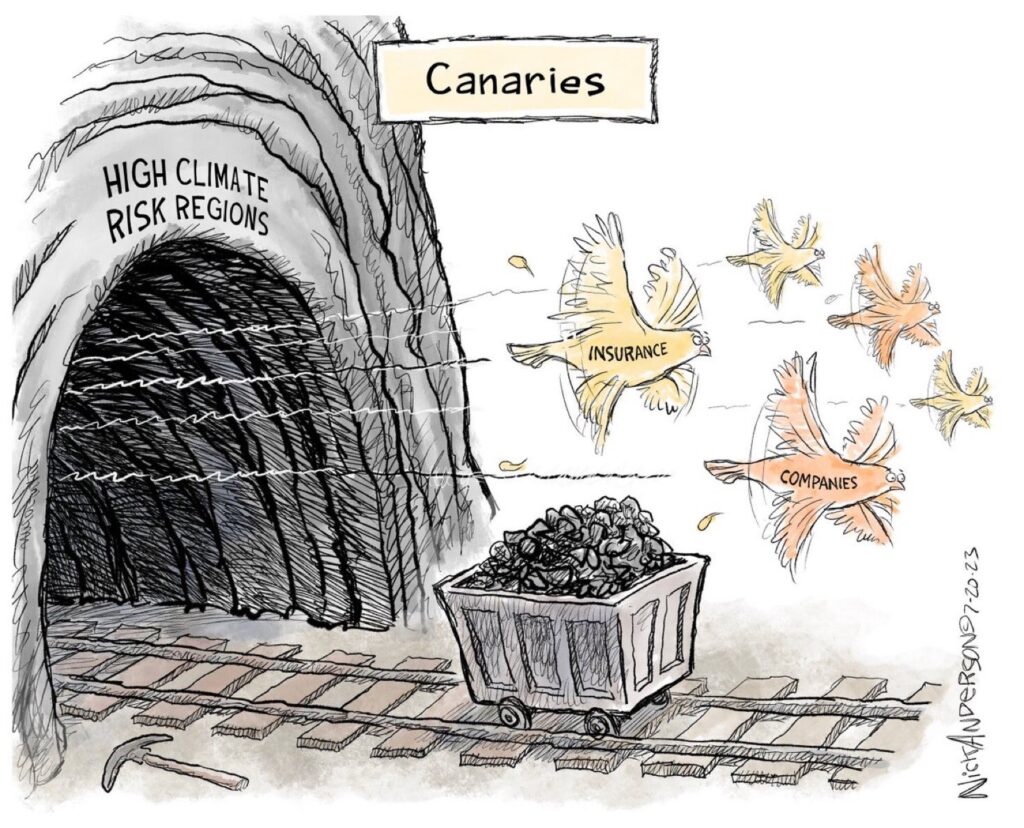
Not all is lost: “Industry-sponsored programmes that pay people to storm-proof their homes — such as Strengthen Alabama Homes — have been shown to lower insurance premiums for high-risk areas.”