Fossil fuel methane emissions likely underestimated in a model based on atmospheric delta-13C trends by Benjamin T. Uveges, Robert W. Howarth and Jed P. Sparks, June 13, 2025, PNAS
Letter, Earth, Atmospheric, and Planetary Sciences
https://doi.org/10.1073/pnas.2507837122
![]() Oil and gas companies have been frac’ing for decades and continue to frac, shallow microbial or biogenic methane, along with deeper fracs. In my community, most of Encana’s ultra shallow fracs for years targeted microbial methane; Alberta’s Research Council reported experimenting with injecting various microbes into shallow gas zones being frac’d, to create microbial methane in real time. Frac’ing can destroy the caprock, and is likely causing significant amounts of microbial methane to leak to surface, outside of frac’d wellbores. Just because it’s called biogenic does not make it natural. Then there are the shoddy work practices by greedy oil and gas companies causing significant leaks via the well bore with studies showing that newer wells are the worst leakers. Canada’s federal energy regulator published in 2009, that companies in Canada are targeting biogenic or microbial methane (refer below for link to their report).
Oil and gas companies have been frac’ing for decades and continue to frac, shallow microbial or biogenic methane, along with deeper fracs. In my community, most of Encana’s ultra shallow fracs for years targeted microbial methane; Alberta’s Research Council reported experimenting with injecting various microbes into shallow gas zones being frac’d, to create microbial methane in real time. Frac’ing can destroy the caprock, and is likely causing significant amounts of microbial methane to leak to surface, outside of frac’d wellbores. Just because it’s called biogenic does not make it natural. Then there are the shoddy work practices by greedy oil and gas companies causing significant leaks via the well bore with studies showing that newer wells are the worst leakers. Canada’s federal energy regulator published in 2009, that companies in Canada are targeting biogenic or microbial methane (refer below for link to their report).![]()
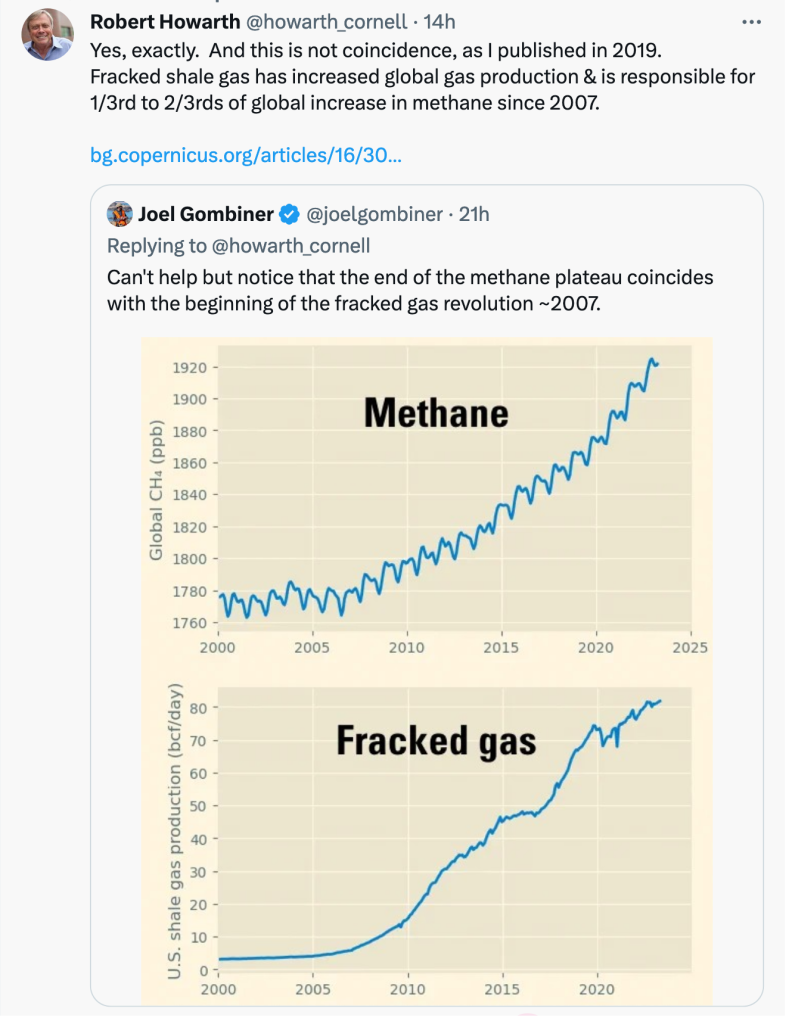
Based on trends in delta-13C of atmospheric methane over time, Michel et al. concluded that increased emissions from microbial sources are primarily responsible for the large growth of methane in the atmosphere since 2008 (1). They suggested these microbial emissions increased by 22 Tg/y between 2008 and 2020 and by an additional 32 Tg/y between 2020 and 2022, compared to only 3 Tg/y for fossil fuels between 2008 and 2020 and no increase in 2020 and 2022.
We believe that they may have significantly underestimated the increase in emissions from fossil fuels since 2008. Here, we demonstrate our concern by detailing the rapid increase in methane emissions from just one sector of fossil fuels, natural gas in the United States, as well as illustrating how a very modest, feasible change in model input parameters can fully accommodate the observed shift.
The most striking change in fossil fuel production globally since 2008 has been the shale gas revolution in North America. Indeed, shale gas was not commercially viable until early this century, yet it now makes up more than 80% of all gas production in the United States, which is currently the largest producer and exporter of natural gas globally (2).
Increased methane emissions from US natural gas production and distribution are globally significant and far exceed the changes estimated by Michel et al. for all fossil fuels (Table 1). We consider it unlikely that increased emissions from natural gas in the United States has been offset by decreased emissions from other fossil fuels and from natural gas elsewhere, as the consumption of all fossil fuels continued to grow globally through 2022, including for oil and coal in addition to natural gas (3). Table 1. Methane emissions from natural gas production, export, and use in the United States for 2008, 2020, and 2022 (Tg/y) (Table view)
| 2008 | 2020 | 2022 | |
|---|---|---|---|
| Upstream & midstream emissions (other than for LNG exports)* | 12.6 | 20.3 | 21.1 |
| Downstream distribution emissions† | 3.2 | 5.1 | 5.3 |
| Emissions from LNG exports from the United States‡ | 0 | 2.2 | 3.5 |
| Total natural gas emissions | 15.8 | 27.8 | 29.9 |
| Change in emissions from preceding time point | – | +12.0 | +2.1 |
*Calculated from an emission rate of 2.95% of production, the mean value from a recent review based on almost one million observations (4); production data and LNG exports are from Energy Information Agency of US Dept. of Energy as recently summarized (2); LNG exports are subtracted from total production, since LNG emissions are considered separately.
†Calculated from an emission rate of 2.46% of gas fed through urban distribution systems, the mean value from a recent review (5); assumes 30% of natural gas used in the US is fed into downstream gas distribution systems for consumption in homes and commercial buildings (6).
‡LNG exports are based on data from Energy Information Agency; methane emission estimates are for average tankers as described in a recent synthesis (2).
To try and reconcile this apparent observation–model mismatch, we suggest that Michel et al. may have overestimated the amount of microbial methane emissions due to their choice of delta-13C value for methane from microbial sources. Outputs from global box models are very sensitive to input parameters, and small changes in rates of biomass burning and the isotopic composition of shale gas can lead to major changes in conclusions (7, 8). In this case, Michel et al. assumed a microbial source delta-13C value of -61.7‰ (1). If increased microbial emissions in recent years were driven primarily by changes in arctic and boreal fluxes which have delta-13CCH4 values of -68.0 to -71.0‰ on average (9, 10), the choice of -61.7‰ would lead to an overestimate of the total microbial flux, with a concomitant underestimate of fossil fuel emissions. To test this hypothesis, we modified the delta-13CCH4 of microbial emissions at each step-change point used by Michel et al. (2008, 2014, and 2020) and recalculated the inferred microbial and fossil fuel-derived methane fluxes. In short, we assumed that any “new” microbial emissions above the 2007 baseline had an isotopic composition comparable to arctic/boreal wetland emissions (delta-13CCH4 = -68.0‰ or -71.0‰). Our recalculated changes in fossil fuel–derived methane emissions (Table 2) can more than accommodate those observed from US shale gas (2), as well as additional sources outside of the United States. Table 2. Comparing fossil fuel–derived methane emission observations with estimates from different parameterizations of box model of Michel et al. (Tg/y) (Table view)
| Change in fossil fuel derived methane emission rate (Tg/y) | ||||
|---|---|---|---|---|
| Year of change | Original model (1) | US shale gas estimates (2)* | New calculations, δ13Carctic = −71‰† | New calculations, δ13Carctic = −68‰† |
| 2008 | 10 | unk. | 15 | 13.8 |
| 2014 | 3 | 6 | 10.8 | 9 |
| 2020 | 0 | 6 | 11.4 | 8.7 |
| 2022‡ | – | 2.1 | – | – |
*Estimates for the change in US shale gas methane emissions were calculated for the period between 2008 and 2020 (2). Here, the 12 Tg/y change shown in Table 1 has been equally split across the 2008 to 2014 and 2014 to 2020 time periods.
†delta-13Carctic represents the delta-13CCH4 value used for microbial methane emissions above the 2007 baseline. In practice, when using delta-13Carctic = -68‰, this resulted in microbial emission delta-13CCH4 values of -61.9‰, -62.2‰, and -62.5‰ at the 2008, 2014, and 2020 step changes respectively.
‡The model used by Michel et al. (1) did not show a change in rates between 2020 and 2022 specifically, but rather modeled a single step change in 2020.
Department of Ecology and Evolutionary Biology, Cornell University, Ithaca, NY 14853
To whom correspondence may be addressed. Email: email hidden; JavaScript is required.
Competing interests statement:
The authors declare no competing interest.
This article is distributed under Creative Commons Attribution License 4.0 (CC BY).
Acknowledgments
We thank the Park Foundation for a grant that supports the efforts of RWH on methane and climate change.
Author contributions
B.T.U. and R.W.H. designed research; B.T.U. performed research; B.T.U., R.W.H., and J.P.S. analyzed data; and B.T.U., R.W.H., and J.P.S. wrote the paper.
Competing interests
The authors declare no competing interest.
- S. E. Michel et al., Rapid shift in methane carbon isotopes suggests microbial emissions drove record high atmospheric methane growth in 2020–2022. Proc. Natl. Acad. Sci. U.S.A. 121, e2411212121 (2024). Crossref. PubMed.
2. R. W. Howarth, The greenhouse gas footprint of liquefied natural gas (LNG) exported from the United States. Energy Sci. Eng. 12, 4843–4859 (2024), Crossref.
3. Institute for Energy Research, Fossil fuels remain strong in 2022 globally, despite increases in renewable energy. https://www.instituteforenergyresearch.org/international-issues/fossil-fuels-remain-strong-in-2022-globally-despite-increases-in-renewable-energy/. 28 June 2023.
4. E. D. Sherwin et al., US oil and gas system emissions from nearly one million aerial site measurements. Nature 627, 328–334 (2024). Crossref. PubMed.
5. R. W. Howarth, Methane emissions from the production and use of natural gas. EM Mag. 11–16 (2022).
6. Energy Information Administration, Natural gas explained: Use of natural gas, U.S. Department of Energy. https://www.eia.gov/energyexplained/natural-gas/use-of-natural-gas.php. 28 April 2023.
7. J. R. Worden et al., Reduced biomass burning emissions reconcile conflicting estimates of the post-2006 atmospheric methane budget. Nat. Commun. 8, 2227 (2017). Crossref. PubMed.
8. R. W. Howarth, Is shale gas a major driver of recent increase in global atmospheric methane? Biogeosciences 16, 3033–3046 (2019). Crossref.
9. R. E. Fisher et al., Measurement of the 13C isotopic signature of methane emissions from northern european wetlands. Glob. Biogeochem. Cycles 31, 605–623 (2017). Crossref.
10. Y. Oh et al., Improved global wetland carbon isotopic signatures support post-2006 microbial methane emission increase. Nat. Commun. Earth Environ. 3, 1 (2022).
![]()
Refer also to:
2020: Thank you Anthony Ingraffea and Robert Howarth!
2013: Methane Leaks from Fracking are Much Worse than We Thought
2009: National Energy Board’s A Primer for Understanding Canadian Shale Gas – Energy Briefing Note
…As mud turns into shale during shallow burial, generally just a few hundred metres deep, in the “nursery”, bacteria feed on the available organic matter (up to 10 per cent of the rock volume but generally less than five per cent) and release biogenic methane as a byproduct (Figure 3). Natural gas is also generated during deep burial while the shale is in the “kitchen”, generally several kilometres deep, where heat and pressure crack the organic matter, including any oil already produced by the same heat and pressure, into smaller hydrocarbons, creating thermogenic methane (Figure 3). Some of the oil and gas manages to escape and migrate into the more porous rock of conventional reservoirs. In fact, the vast bulk of the world’s conventional reserves of oil and gas were generated in and escaped from organic-rich shales. But some oil and gas does not escape, as it is either trapped in the micropore spaces or attached to the organic matter within the shale. For example, the natural gas produced from the Second White Specks Shale of Alberta and Saskatchewan comes from shallow burial (it is shallow enough that gas is still being generated by bacteria), while the natural gas from the Devonian Horn River Basin and Triassic Montney shales was generated during deep burial. The Utica Shale of Quebec has both shallow and deep sections and there is potential for both biogenic and thermogenic natural gas, respectively.
The origins of natural gas become important when evaluating shale-gas prospects. For example, thermogenic systems often produce natural gas liquids with the methane, which can add value to production, whereas biogenic systems generate methane only. Thermogenic systems can also lead to the generation of carbon dioxide as an impurity in the natural gas, which costs money to remove and can increase greenhouse-gas emissions. Thermogenic plays tend to flow at high rates, but are normally exploited through the extensive use of horizontal drilling and are therefore more expensive to develop than biogenic plays, which flow at lower rates and are exploited through shallow, closely spaced vertical wells instead.
…
However, shale gas, both biogenic and thermogenic, remains where it was first generated and can be found in three forms: 1) free gas in the pore spaces and fractures; 2) adsorbed gas, where the gas is electrically stuck to the organic matter and clay; and 3) a small amount of dissolved gas that is dissolved in the organic matter. … Individual gas shales appear to have hundreds to thousands of billion cubic metres (tens to hundreds of Tcf) of gas in place spread over hundreds to thousands of square kilometres. The difficulty lies in extracting even a small fraction of that gas. The pore spaces in shale, through which the natural gas must move if the gas is to flow into any well, are 1000 times smaller than pores in conventional sandstone reservoirs. The gaps that connect pores (the pore throats) are smaller still, only 20 times larger than a single methane molecule. Therefore, shale has very low permeability. However, fractures, which act like conduits for the movements for natural gas, may naturally exist in the shale and increase its permeability.
…