Study Links Permian Blowouts With Wastewater Injection, Fluids traveled 12 miles underground before reaching an abandoned oil well and shooting to the surface. It’s the first scientific proof of a phenomenon local landowners have long warned was occurring by Dylan Baddour, Inside Climate News, and Carlos Nogueras Ramos, Texas Tribune, August 7, 2024
Fracking wastewater, injected underground for permanent disposal, traveled 12 miles through geological faults before bursting to the surface through a previously plugged West Texas oil well in 2022, according to a new study from Southern Methodist University.
It’s the first study to draw specific links between wastewater injection and recent blowouts in the Permian Basin, the nation’s top producing oil field, where old oil wells have lately begun to spray salty water.
It raises concerns about the possibility of widespread groundwater contamination in West Texas and increases the urgency for oil producers to find alternative outlets for the millions of gallons of toxic wastewater that come from Permian Basin oil wells every day.
“We established a significant link between wastewater injection and oil well blowouts in the Permian Basin,” wrote the authors of the study, funded in part by NASA and published last month in the journal Geophysical Research Letters. The finding suggests “a potential for more blowouts in the near future,” it said.
For years, the Texas agency that regulates the oil and gas extraction industry has refrained from putting forth an explanation for the blowout phenomenon, even as a chorus of local landowners alleged that wastewater injections were driving the flows of gassy brine onto the surface of their properties since about 2022.
Injection disposal is currently the primary outlet for the tremendous amount of oilfield wastewater, also known as produced water, that flows from fracked oil wells in West Texas. Thousands of injection wells dot the Permian Basin, each reviewed and permitted by Texas’ oilfield regulator, the Texas Railroad Commission.
Oil producers are exploring alternatives—a small portion of produced water is reused in fracking, and Texas is in the process of permitting facilities that will treat produced water and release it into rivers and streams. Still, underground injection remains the cheapest and most popular method by far.
A scientific connection has solidified between the practice of injection disposal and the increasing strength and frequency of earthquakes nearby. In the Permian Basin, a steady crescendo of tremors peaked last November with magnitude 5.4 earthquake, the state’s strongest in 30 years, triggering heightened restrictions on injections in the area.
The link between injections and surface blowouts, however, has remained unconfirmed, despite widespread suspicions. The latest study marks a big step forward in scientific documentation.
“It just validates what we’ve been saying,” Sarah Stogner, an oil and gas attorney who ran an unsuccessful campaign for a seat on the Railroad Commission in 2022, said about the latest study.
For the last three years, Stogner has represented the Antina Cattle Ranch, where dozens of abandoned oil wells have been spraying back to life. Stogner persistently alleged that nearby wastewater injection was responsible. But she couldn’t prove it.
Now a scientific consensus is beginning to fall in behind her.
“Our work independently comes to this same conclusion in different areas [of the Permian Basin],” said Katie Smye, a geologist with the Center for Injection and Seismicity Research at the University of Texas at Austin, citing several upcoming papers she and her colleagues will release at major geoscience conferences in the coming year. “There is a link between injection and surface flows in some cases.”
In a study published December 2023, Smye and others reported “linear surface deformation features” in parts of the Permian Basin—the ground was swelling along channels that suggested pressure moving through underground faults. Some of those were ancient geological faults, Smye said; others appeared to be created by recent human activity. Many of them were growing, heaving and bulging, the research showed.
When that channel of underground pressure hits an old oil well that is broken or improperly plugged, it can shoot to the surface.
“This is reaching a critical point in the Permian Basin,” Smye said. “The scale of injection needs is increasing.”
About 15 million barrels, or 630 million gallons, of produced water are injected for disposal in the Permian Basin every day, Smye said.
A Railroad Commission spokesperson, Patty Ramon, said in a statement the agency is “talking to operators in the Crane County area regarding geology and other data they maintain, reviewing satellite imagery, and analyzing RRC records such as well plugging information.
“We will be continuing this type of analysis in our commitment to ensuring environmental protection,” Ramon said.
Blowout in 2022
The SMU study examined a January 2022 blowout in Crane County that gushed almost 15 million gallons of brine before it was capped, according to the paper. That would fill about 23 Olympic-sized swimming pools.
The study traced the cause of the blowout to a cluster of nine injection wells about 12 miles to the northeast. Researchers pulled publicly available data on injection volumes at those wells and found they lined up closely to surface swelling that preceded the blowout. Seven of the wells belong to Goodnight Midstream and two belong to Blackbeard Operating, according to Railroad Commission records.
A spokesperson for Blackbeard said the company “is committed to ensuring prudent operations” and “will continue to operate its assets in accordance with all applicable laws and in coordination with all applicable regulatory agencies.”![]() The usual oil and gas escape hatch lingo. Committed to ensuring is meaningless. If the company gave a damn, they’d say they were ensuring prudent operations, without the escape hatch word committed. Promising to follow all laws and regs is also meaningless. Just a promise. A promise that rarely happens in reality.
The usual oil and gas escape hatch lingo. Committed to ensuring is meaningless. If the company gave a damn, they’d say they were ensuring prudent operations, without the escape hatch word committed. Promising to follow all laws and regs is also meaningless. Just a promise. A promise that rarely happens in reality.![]()
A spokesperson for Goodnight said the company is dedicated to operating its facilities responsibly and in full compliance with legal requirements.![]() Same escape hatch as committed to using fancier language, but just as meaningless. If the company were truly dedicated to operating appropriately, they’d just say so like this: “Our company operates responsibly and in full compliance with the law.”
Same escape hatch as committed to using fancier language, but just as meaningless. If the company were truly dedicated to operating appropriately, they’d just say so like this: “Our company operates responsibly and in full compliance with the law.”![]()
“We work proactively with regulatory agencies and industry workgroups to ensure our operations are at the forefront of geologically sustainable solutions,”![]() That’s completely meaningless. Hogwash, at best
That’s completely meaningless. Hogwash, at best![]() the spokesperson said. “Our commitment to safety, environmental stewardship, and community engagement is the foundation for everything we do.”
the spokesperson said. “Our commitment to safety, environmental stewardship, and community engagement is the foundation for everything we do.”
According to the paper, injection at those nine wells began in 2018 at a rate of about 362,000 gallons per day and doubled to 720,000 gallons per day in late 2019. In late 2020 it doubled again to 1.5 million gallons—two Olympic-sized swimming pools crammed underground everyday—which is when the ground near the blowout site began to inflate.
The study found that the volume injected matched the volume of the surface bulge 12 miles away.
“These observations suggest that this group of injection wells to the NW of the study area, injecting into the San Andres and Glorieta formations, is responsible for the surface deformation in the region,” the study said.
“Our findings highlight the need for stricter regulations on wastewater injection practices and proper management of abandoned wells.”
Those wells reached a depth between 4,300 and 3,300 feet. But the SMU study found that the source of the bulge in the earth was much shallower, between 2,300 and 1,600 feet underground.
“This suggests the leakage of wastewater from the San Andres or Glorieta formations to the shallow formations,” the study said.
The bottom of the Rustler Aquifer, the lowest usable source of groundwater in the Permian, sits between 800 and 1,000 feet underground. The SMU study did not examine the possibility of groundwater contamination.
“Our findings highlight the need for stricter regulations on wastewater injection practices and proper management of abandoned wells,” the study said.
Todd Staples, president of the Texas Oil and Gas Association, said the Railroad Commission “is taking appropriate action by thoroughly gathering and reviewing data to address the issues experienced in Crane County.”
He said the industry cooperates with the Railroad Commission by providing data to help analyze geological formations.
“In addition, the industry and academia continue to explore alternatives to wastewater injection through market-based water reuse and recycling as well as innovative pilot programs,” Staples said.
Damaged Land
West Texas ranchers who own land where contaminated water is seeping from underground are beginning to worry it will soon become uninhabitable.
Last February, saltwater flooded parts of Bill Wight’s ranch, about 50 miles southwest of Odessa. The lifelong rancher purchased the land in 2012, hoping to pass it on to his kids. He told The Texas Tribune he wasn’t sure how much of the ranch would survive the leaking wells.
When it was clear the flow of water threatened the property last December, he asked the Railroad Commission to seal the well the water had leaked from. It took the commission months and millions of dollars to plug the well.
His brother, Schuyler Wight, faces a similar predicament at his ranch roughly 60 miles to the west in Pecos County. He has asked the Railroad Commission for years to investigate the multiple abandoned leaking wells on his property. The liquid has eroded the equipment on the surface and killed the plants. After the water dried up, the ground was crusted white from salt.
“It’s what we’ve known all along,” Schuyler Wight said. “What we’re doing is not sustainable.”

Ashley Watt, owner of a ranch 50 miles east of Schuyler Wight’s ranch in Crane County, told the Texas Railroad Commission during a 2022 meeting that she believed excessive injection by nearby oil producers was causing the fluids to spray from abandoned oil wells on her property.
A Railroad Commission staff member said the agency asked operators to check for a source of the leak. The operators told the commission they did not find any. The Railroad Commission during the meeting also said they did not find a well in the agency’s database, and that the nearest injection wells were less than two miles away.
The agency instructed staff to prevent truckers from accessing those injection sites, telling operators to find others “until further notice.”
The wells continue to leak.
Laura Briggs, who also owns a ranch in Pecos County less than half a mile east of Schuyler Wight’s place, said she has seen five old wells start leaking water since 2015. The Railroad Commission plugged two of them, she said, but one began to leak through the seal again.
Briggs has repeatedly given testimony and submitted documentation to the Railroad Commission asking for help. Based on her experience, she believes the subterranean problems in West Texas are much more than what the Railroad Commission can handle.
“If I could do one thing differently, we would have gotten a mobile home so it was easier to get the hell out of here,” Briggs said. “If this [ranch] goes leaking, we just have to leave and nobody will buy the property, no insurance will cover it, you’re just done.”
Despite those problems, the Railroad Commission approved 400 new disposal wells in the Permian Basin alone in 2021, according to agency documents, and 480 in 2022.
Threats to Groundwater
The use of injection wells for disposal has expanded immensely with the practice of fracking, according to Dominic DiGiulio, a geoscientist who worked for 30 years at the U.S. Environmental Protection Agency. But DiGiulio said these wells are still regulated under rules from the 1970s and ’80s. Increasingly, he said, those rules appear insufficient.
“West Texas isn’t the only place where this is happening,” DiGiulio said. “Overpressurization of aquifers due to disposal of produced water is a problem.”
In 2022, DiGiulio conducted a review of Ohio’s wastewater injection program for the group Physicians, Scientists, and Engineers for Healthy Energy and found the same two problems there: Injected fluids were leaking from some formations meant to contain them, and excessive injections were causing other formations to become overpressurized.
There was one big difference with Texas. In November 2021, DiGiulio’s study said, Ohio had just 228 injection wells for wastewater disposal. Texas, meanwhile, had 13,585 in 2022, according to Railroad Commission documents.
The primary threat posed by produced water migrating from injection wells is groundwater contamination. If deep formations fail to contain the toxic waste injected into them, that waste could end up in shallow freshwater aquifers.
It could happen two ways, DiGiulio said. If the wastewater enters the inside of an old oil well through corroded holes in the casing, it can travel up the steel pipe to the surface, spilling and seeping into the ground. If the wastewater moves up the outside of an old oil well, through the cement that surrounds the steel pipe, it could already be flowing into the aquifer.
That would be bad news for West Texas, which depends almost entirely on groundwater for drinking and crop irrigation.
“Once groundwater contamination happens, it’s too expensive to remediate,” DiGiulio said. “So when it occurs, that’s basically it. You’ve ruined that resource.”
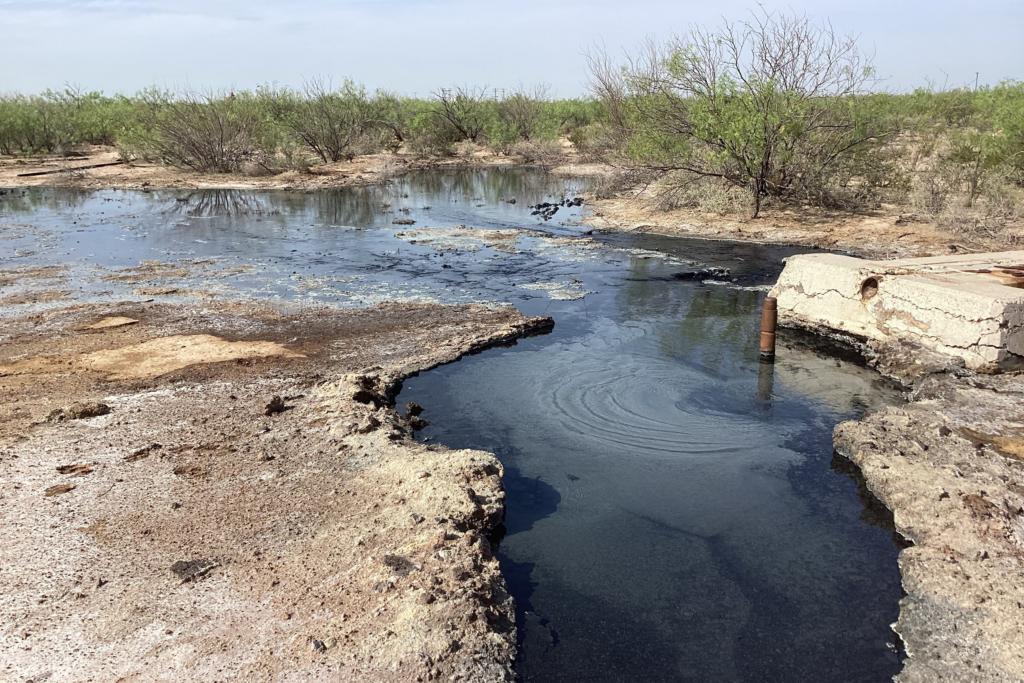
Water flows from an orphaned oil well on Schuyler Wight’s ranch in Pecos County, Texas. Credit: Courtesy of Schuyler Wight
Investigation of Oil Well Blowouts Triggered by Wastewater Injection in the Permian Basin, USA by Vamshi Karanam, Zhong Lu and Jin-Woo Kim, 22 July 2024, Geophysical Research Letters Volume51, Issue 14, 28 July 2024, e2024GL109435
Abstract
Aged hydrocarbon wells, if proper care is not ensured, can crack, get corroded, and leak subsurface fluids. Permian Basin in Texas, home to thousands of such wells, has seen numerous blowouts and wastewater leaks. Our study employs surface deformation derived from satellite observations, and injection well records to investigate these events. The results reveal an over-pressurized wastewater aquifer producing a surface uplift of 20 cm/yr, likely due to wastewater being injected tens of kilometers away. Focusing on a January 2022 blowout resulting in 3 cm subsidence in 2 weeks, our geophysical model suggests aquifer over-pressurization as the cause. With an excess pressure of over 3 MPa in the aquifer, several more such blowouts are possible in the near future. This research highlights the urgent need to better understand the impact of subsurface fluid injection and calls for prompt action to mitigate the environmental effects of oil and gas production.![]() We all know that will never happen but some dare to dream (I gave up on all hope and dreaming when I discovered Encana/ovintiv had illegally intentionally repeatedly frac’d my community’s drinking water aquifers, enabled and covered-up by regulators and politicians.
We all know that will never happen but some dare to dream (I gave up on all hope and dreaming when I discovered Encana/ovintiv had illegally intentionally repeatedly frac’d my community’s drinking water aquifers, enabled and covered-up by regulators and politicians.![]()
Key Points
- We utilized satellite observations of land surface deformation to explore the subsurface anomalies in the Permian Basin
- We established a significant link between wastewater injection and oil well blowouts in the Permian Basin
- We discovered an over-pressurized aquifer responsible for the reported blowouts, with a potential for more blowouts in the near future
Plain Language Summary
Wastewater, a byproduct during oil extraction, is generally injected back into the ground. Permian Basin has witnessed several incidents of leakage of wastewater in the last 3 years. Recently in January 2022, huge amounts of wastewater were expelled at a high pressure from an old well. We used satellite data and wastewater injection data to understand the cause of these events. We found that the wastewater injection happening nearly several kilometers away is responsible for these leakages. We also discovered a highly pressurized wastewater lake below the surface in this region using geophysical modeling. Due to high pressures, the land in this region rose by 40 cm in just 2 years. Meanwhile, a part of this region sunk by 3 cm because of the leakage in January 2022. Our findings raise concerns about the potential for more leakages in the near future if action is not taken.
1 Introduction
The accelerated expansion of hydrocarbon production in recent years, especially the associated wastewater injection, resulted in frequent disturbances to the environment intensified by the complex nature of the subsurface, leading to unintended consequences such as wastewater leakage, fault slips, and sinkhole subsidence (Denlinger & R. H. O’Connell, 2020; J. W. Kim & Lu, 2018). Addressing such issues promptly is vital, as they can pose serious risks to lives, infrastructure, and local to regional ecosystems. In particular, more attention is required to managing the produced wastewater and ensuring proper care of aged and abandoned oil wells (Zheng et al., 2019).
The Permian Basin (PB) is home to huge oil reserves and has been exploited for over a century with the Central Basin Platform (CBP) currently being used as an injection sink of the saline wastewater, a byproduct of the hydrocarbon production (Enverus, 2023; Popova & Long, 2022). This injected water is expected to diffuse within the injected formation (Rubinstein & Mahani, 2015). While this is an economically viable approach, the diffusion process may be disrupted due to the complex subsurface in the CBP, the presence of many aged wells, and an increase in injection volumes (Deng et al., 2020). This can lead to various hazards including groundwater contamination, increased fault slips, and the flow of injected water back into surface reservoirs via old and abandoned oil wells (Lustgarten, 2012; Zhai et al., 2021; Zheng et al., 2019). CBP is home to many such aged and abandoned oil wells, intensifying the need for careful management of these potential risks. The leakage of subsurface water through aged wells resulted in the formation of the Boehmer Lake in the CBP in 2002 which has steadily expanded to occupy an area of over 0.25 km2, as of 2023 (J. W. Kim & Lu, 2021). Another hazard associated with hydrocarbon production activities involves the emergence of two sinkholes, named after the nearby city of Wink, due to the intense hydrocarbon production followed by severe droughts (J.-W. Kim et al., 2019). Such instances underscore the consequences and need for proactive measures to mitigate the potential risks of unmanaged wastewater injection.
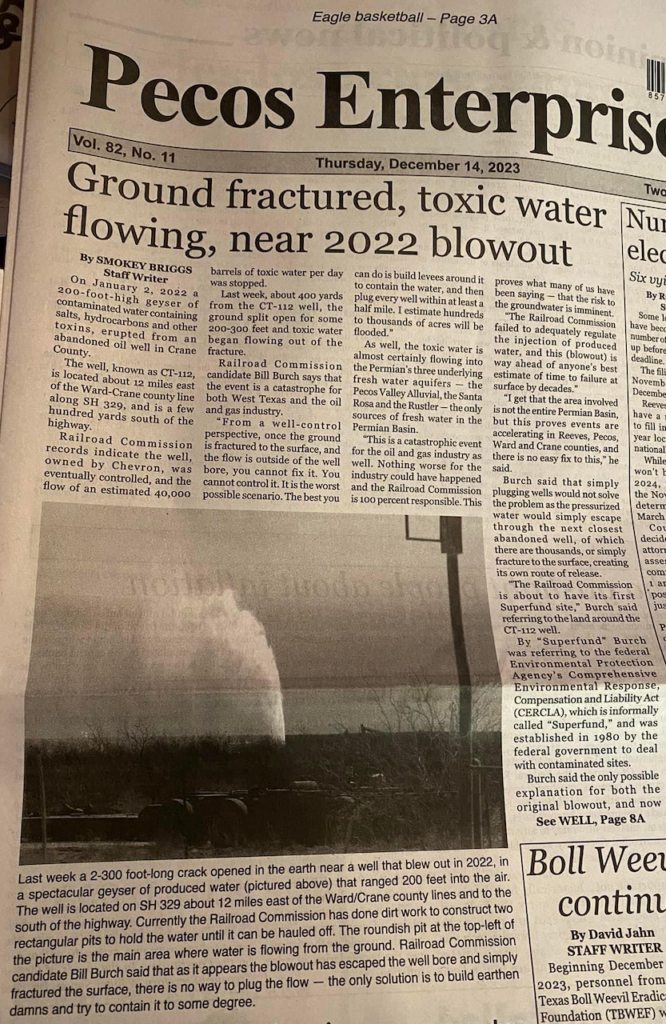
In this study, we discuss another serious issue in the CBP, near Wink sinkholes and Boehmer Lake. In January 2022, an aged well near Tubbs Corner in Crane County failed, resulting in an eruption of the pressurized wastewater from the subsurface reaching nearly 30 m into the sky for 2 weeks (hereinafter referred to as Tubbs Corner Blowout) (Gold, 2022a). Several similar incidents of lesser intensity were also reported over neighboring wells (Gold, 2022b). However, the specific injection wells and subsurface processes driving these well blowouts remain unknown. In this study, we discuss how the complex subsurface geology characterized by high permeability passages in the CBP facilitated the flow of injected wastewater to farther distances, ultimately inducing well blowouts. This study presents a compelling case highlighting the amplified hazards in the CBP resulting from the interplay of natural and anthropogenic processes.
2 Study Area
The CBP, with an elevated zone of basement rock, separates the Delaware Basin and Midland Basins within the larger PB spanning West Texas and Southeast New Mexico (Figure S1 in Supporting Information S1) (E. A. Horne et al., 2021). This study focuses on the southern part of the CBP, specifically on the Crane and Ward counties in Texas (Figure 1a). The study area falls within the Pecos River valley (Meyer et al., 2012). The prevailing groundwater trend within the study area is from north to south, toward the Pecos River (Meyer et al., 2012).

The subsurface stratigraphy is illustrated in Figure 1b. In the CBP, carbonate deposition took place between the Wolfcampian and Guadalupian ages followed by cyclic deposition of sandstone, anhydrite, and halite during the middle Guadalupian (Ward et al., 1986). San Andres, Grayburg, and Queen formations which are composed of shelf carbonates of Guadalupian age account for most of the hydrocarbon production from the CBP. Seven Rivers, Yates, and Tansill formations are stratigraphically above and have similar depositions. Above the Tansill Formation are the Salado Formation composed of halite with thin beds of anhydrite and the Rustler Formation composed of red beds and sand from the Ochoan age. Conventional production from carbonate formations lasted for decades in the mid-1900s. Between 1950 and 1990, a few oil companies drilled several wells to produce water used for enhanced oil recovery. Currently, most of the injection wells are more than 1 km deep, injecting into the San Andres, Glorieta, and Tubb formations.
The hydrocarbon extraction activities in the study area are limited and the land is primarily used for ranching. Meanwhile, reports of several well blowouts that resulted in wastewater leakage onto the surface have emerged in the past (Gold, 2022b). The Tubbs Corner blowout occurred on 01 January 2022, at an abandoned well near Tubbs Corner in Crane County ejecting saltwater up to 30 m high at a rate of 4,000 m3/day. The bottom of the aged well responsible for the blowout is in the Yates Formation at around 425 m below the surface (Gold, 2022a; Ward et al., 1986). This continued for nearly 14 days before the well was cemented. There are no active injection wells in the vicinity with injection volumes large enough to explain such a blowout event. Also, the processes contributing to such elevated pressure zones in the subsurface remain unknown.
3 Methods
To understand the temporal evolution of the deformation, we performed an Interferometric Synthetic Aperture Radar (InSAR) analysis of 97 Sentinel 1 A/B Single Look Complex (SLC) data sets acquired in descending geometry from January 2020 to May 2023. First, we generated an optimized set of 520 Interferograms with a maximum temporal baseline of 60 days (Figure S2 in Supporting Information S1). We derived the deformation time series by inverting the interferogram network using the Small Baseline Subset (SBAS) method (Yunjun et al., 2019). Subsequently, assuming that the deformation due to fluid extraction is primarily vertical and ignoring horizontal deformation, the line of sight (LOS) displacements were converted into vertical deformation results (Karanam et al., 2021). Complete details of the processing workflow are provided in Text S1 of Supporting Information S1. Further, we have estimated the deformation between successive acquisitions to understand its evolution between individual timesteps in the time series. Data from ascending tracks were not used here as there were gaps in the data acquisition. However, we have used the available data from the ascending data sets for validation purposes (Figures S3 and S4 in Supporting Information S1). We used high-resolution (3 m) satellite imagery acquired by the PlanetScope Constellation system from Planet Labs to visualize the surface changes during and after the well blowouts (PBC, 2018). Further, we have modeled the surface deformation using the penny-shaped crack modeling method to estimate the source depth and geometry (Fialko et al., 2001). To correlate the deformation results with the wastewater injection activities, we obtained data on injection well locations within the study area, their depths, and monthly injection volumes from the Form H-10 filing system in the Railroad Commission of Texas (RRC) database. We calculated the cumulative deformation volumes by multiplying each pixel’s area by its corresponding cumulative uplift value and then summing these products for all pixels within the study area. These cumulative uplift volumes are compared to the cumulative injection volumes to find the correlation between the two. The TexNet seismology database did not record any earthquakes in the study area (Savvaidis, 2021).
4 Results
4.1 Surface Deformation Observations
The time-series deformation results from InSAR offer a compelling insight into the dynamic subsurface processes in the region. The deformation, primarily uplift, exhibits both temporal and spatial variability, occasionally accompanied by localized subsidence. The most prominent observation from the annual surface deformation rate map is an uplift pattern extending linearly from the northwest (NW) to the southeast (SE) (Figure 2a). The time-series graphs show that the uplift initially started in the NW corner of the study area and slowly propagated to the SE corner (Figure 2b). Location A experienced an uplift of around 1 cm/yr throughout the study period. At location B, the sharper and more localized uplift signal in the middle of a broader, and gentler uplift hints at a shallow source depth, in comparison to location A (Zheng et al., 2019). The deformation in this region accelerated between January 2021 and July 2021 before slowing down. The deformation at location C was initiated in January 2021, producing an uplift of 4 cm in the next 6 months before decelerating. Meanwhile, at location D, an uplift started after July 2021, registering a substantial uplift of more than 40 cm in the next 2 years. Interestingly, the uplift signal did not extend south of location D during the same period. The time series maps show a notable increase in the uplift in locations A, B, C, and D, gradually connecting through a series of smaller uplift signals (Figure S5 in Supporting Information S1).

We analyzed distinct epochs in more detail by differencing consecutive acquisitions to highlight the frequent changes in deformation patterns. The resulting maps show the occasional emergence of localized subsidence signals that stand out against the broader inflation background (Figure 2c). Numerous instances of such subsidence signals were observed across the deforming area at different periods (Figure S6 in Supporting Information S1). Most importantly, a subsidence event between 02 January 2022, and 14 January 2022, can be observed from these deformation maps that produced a subsidence of 3 cm in 12 days (Figure 2c). The same is also evident in the time series graph and stands in contrast to the general uplift trend observed in the region (Figure 2b). The location and timing of the subsidence signal align with the Tubbs Corner blowout (Gold, 2022a). It can be inferred from the spatial extent of the subsidence signal that the source geometry for the blowout correlates with the general uplift trend. A wastewater aquifer in an over-pressurized state may be responsible for the uplift trend. The wastewater ejected at high pressures during the blowout also supports this inference. A comprehensive view of the blowout showing the ejected water is provided by the PlanetScope Constellation system (Figure S7 in Supporting Information S1) (PBC, 2018). Further, several instances of wastewater leakage were reported in the region along the pathway (Gold, 2022b). It is possible that the subsidence signals observed over a few other epochs are linked to such blowout events (Figure 2c). The wastewater volume ejected during these blowouts is reportedly much lower than the magnitude observed during the Tubbs Corner blowout, which can also be inferred from the smaller magnitudes of subsidence. Therefore, these blowout events could not be observed in the Planet imagery. Details of these blowouts are not available for further analysis. Figure 2d shows the temporal evolution of the surface deformation over the region, with each contour line representing the extent of deformation at a particular time, indicated by its color. The contour lines are separated by a 60-day time interval, and a minimum deformation threshold of 2 cm is chosen to classify the pixels as deforming. The results show a distinctive pattern of the expansion of two elliptical patterns. Until May 2021, the uplift was limited to the upper circle. Over the next 2 months, another deformation feature emerged over the lower circle, eventually merging with the upper circle in the subsequent 4 months, resembling a dumbbell. In the later months, while the uplift in the lower part expanded radially, the upper circle showed less expansion. In the last few months, the deformation pattern has seen limited spatial expansion, while no change was observed in the deformation rate. Similar maps for the remaining parts of the study area are provided (Figure S8 in Supporting Information S1).
4.2 Injection Activities
The reported injection data available up to mid-2023 reveals no active injection wells directly over the regions experiencing significant deformation. A cluster of injection wells toward the NW of the study area contributed to most of the wastewater injection in the study area (Figure 2a). Given its proximity to the affected regions, we obtained the well depths and injection volumes for these wells for further analysis. We observed that these injection wells fall within the extent of the deformation feature at location A, which is experiencing an uplift of about 1 cm/yr. The cumulative deformation volumes calculated by multiplying the pixel area with the cumulative uplift for each pixel strongly correlate with the cumulative wastewater volumes injected into the group of wells in the NW (Figure 2e). The injection started in late 2018 and continued at a rate of 0.5 M m3/y until late 2019 before accelerating to a rate of 1 M m3/y till late 2020. This further accelerated to a rate of 2 M m3/y beginning in late 2020, which also coincides with the onset of significant surface deformation. The remaining wells surrounding the study area inject comparatively negligible amounts of wastewater. These observations suggest that this group of injection wells to the NW of the study area, injecting into the San Andres and Glorieta formations, is responsible for the surface deformation in the region.
…
5 Discussion
Based on the observations from InSAR analysis, the injection data, penny-shaped crack modeling, and other ancillary data sets, we will explore the most likely explanation for the source of the uplift and the subsurface structures facilitating the fluid flow in this section.
First, we infer that the injection wells in the NW of the study area are likely responsible for the uplift. Several factors support this inference. The injection into the NW injection well cluster exhibits spatial proximity and temporal correlation with the surface deformation (Figures 2a and 2e). Meanwhile, no significant uplift is observed (∼1 cm/yr) right above the injection wells, suggesting rapid diffusion of injected water. The pore pressure accumulation along the surface flow path is much lower at B or C than D. This can also be inferred from lower uplift values along the path (∼6 cm at B and ∼8 cm at C) compared to the uplift at the blowout well (∼40 cm) (Figure 2b). However, several incidents of wastewater leakage of smaller magnitudes have been reported over the subsurface flow paths since 2020 (Gold, 2022b). Details of these blowouts are not available for further analysis. The injection depths are around 1–1.3 km, while the source of observed deformation over location B close to injection wells as estimated from the spatial patterns, is around 500–700 m. This suggests the leakage of wastewater from the San Andres or Glorieta formations to the shallow formations, either Yates or Seven Rivers formations.
Further, the wastewater is likely transported from the injection wells to the blowout site through highly permeable subsurface flow paths (such as preexisting groundwater pathways). The surface deformation maps show the deformation along a narrow path possibly due to the pressure diffusion along this path, propagated southward, indicating a narrow high permeability zone within the shallow formation (Figure 2a). This inference is supported by the absence of any strictly linear deformation patterns that represent fault traces similar to those observed in the Delaware Basin (Karanam & Lu, 2023). Moreover, the general groundwater trend in the region corresponds with the deduced wastewater flow direction (Anaya & Jones, 2009; Bruun et al., 2016). High-resolution subsurface formation maps can help strengthen this inference.
The presence of a highly pressurized shallow aquifer at the blowout site, accumulating the wastewater transported from injection wells, is evident from the deformation results and the incidents of well blowouts. Based on the assumptions of the penny-shaped crack model, the total wastewater volume responsible for the uplift should be equivalent to the total uplift volume at the end of the study period, which is approximately 2.5 million m3. Out of this, close to 1 million m3 of wastewater is stored in the aquifer. The remaining two-thirds of the total injected water of more than 6 million m3 may have diffused away in other directions, depending on the permeability of the formation. Additionally, well logs reveal that the depth to the top of the San Andres formation is anomalously high over the uplifting region (Figure S9 in Supporting Information S1) (Enverus, 2023). This can provide further strength to the hypothesis that a thick, and shallow aquifer is present here and is accumulating significant amounts of wastewater. However, we do not exclude the possibility of human errors, such as inaccuracies during well-log interpretation.
While the water is restricted from diffusing further south, possibly by a low permeability barrier, the inflow of wastewater from the north continues, increasing the pressure inside the aquifer over time. A high uplift gradient (25 cm/km) is observed over the aquifer providing further strength to this inference (Figure S10 in Supporting Information S1). As the pressure in the aquifer increased, it may have led to the failure of the aged wells, resulting in well blowouts. The occurrence of these blowouts can be attributed to various factors. Firstly, over time, the plugs may have worn out and failed, possibly due to the excess pressure exerted by the wastewater. It is also possible that the wells were not plugged adequately in the first place. Some reports also suggest that the casing of the wells got corroded, allowing the water to enter from the sides of the well (Gold, 2022b). Salt dissolution may also have occurred in the Salado Formation during the blowouts, as previously observed at Boehmer Lake. If this continues, in addition to more well blowouts and wastewater leakage, this area may also experience sinkhole subsidence, similar to Wink sinkholes (J.-W. Kim et al., 2019). Further investigations should include a geochemical analysis of blowout water to confirm the source of this wastewater. Seismic reflection studies or ambient noise analyses can help identify subsurface structures, including those facilitating wastewater migration and the barriers restricting water flow. As underground reservoirs increasingly serve as storage sites for captured carbon dioxide in efforts to mitigate the effects of climate change, these monitoring techniques also hold significant potential for use in monitoring the pressure changes and potential leakage of CO2 and ensuring the integrity and safety of these sequestration efforts (e.g., Yang et al., 2015).
6 Conclusions
This study combines InSAR analysis with geodetic modeling to reveal the source of oil well blowouts in Crane County, West Texas. The results suggest that the injected wastewater leaked to shallower formations and propagated through subsurface flow paths. The water then accumulated in an aquifer several kilometers away resulting in excess pressure that was manifested as a surface uplift exceeding 40 cm in less than 3 years. The failure of aged oil well casings under this pressure led to wastewater blowouts over the aquifer and along the path. The sealing of the failed wells offered only a temporary solution, and the persistent pressurization in the subsurface poses an ongoing risk of future blowouts. The proximity of the highly pressurized area to the Pecos River, less than 5 km away, raises significant environmental concerns. Our findings highlight the need for stricter regulations on wastewater injection practices and proper management of abandoned wells to prevent environmental risks such as well failures, surface subsidence, and potential groundwater contamination.
Acknowledgments
This study was funded by National Aeronautics and Space Administration (NASA) Earth Surface and Interior Program (80NSSC21K1474) and NASA – Indian Space Research Organization (ISRO) Synthetic Aperture Radar mission (NISAR) Science Team (80NSSC22K1888), and the Shuler-Foscue Endowment at Southern Methodist University. The authors declare no competing interests. We are grateful for the scientific guidance and support from Roger P Denlinger of USGS. We thank Tyler G Paladino and two anonymous reviewers for their detailed and constructive comments, which have significantly improved our manuscript.

Refer also to:
GreenLeafTheo Anderson@LeafRevol:
It’s a clear conflict of interest when I see regulators intimidated by the industry they’re supposed to regulate
2024 08 03: @zombiewellz:
Update from Pecos County blowout – taxpayers funding a vac truck to come haul water and dispose of it every 2 hours.
“Started looking at the fence the Railroad Commission built … If they built a fence like this, there’s no way in hell they can plug a well.”
TraderJordanM@DadSoberSoc:
That’s a huge waste of taxpayer money.