Study ties Southwester Pa. town’s water woes to 2022 EQT frack-out and narrow state law, A 2022 fracking mishap involving Pittsburgh-based EQT left New Freeport and Springhill with briny and methane-contaminated water, local researchers found. Because state law limits drillers’ responsibility, residents have few options by Quinn Glabicki, September 17, 2025, Pittsburgh Public Source

Three years and three months after fluid erupted along Main Street in the rural Greene County hamlet of New Freeport, a scientific study published Wednesday contends that the Pittsburgh gas giant EQT contaminated local water, and casts doubt on current standards of regulatory oversight.
The new research comes after two Greene County townships recently issued disaster declarations, while a judge in August declined to grant an injunction in an ongoing class-action lawsuit that would have compelled EQT to provide clean water to residents.
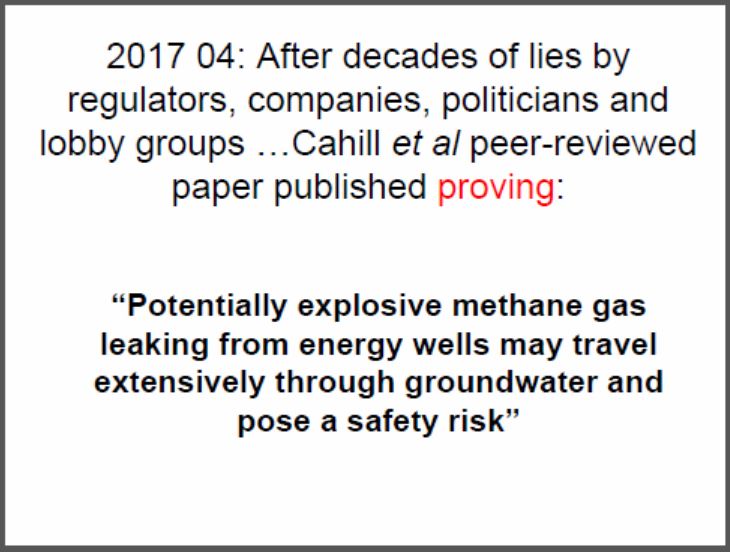
The peer-reviewed study published in Scientific Reports analyzed 75 local water samples in and around New Freeport, finding evidence of oil and gas brine and methane in more than half of the samples. Around one-fifth of the samples had methane above the state action limit, including two with “explosive levels” of gas, according to author John Stolz of Duquesne University.
***
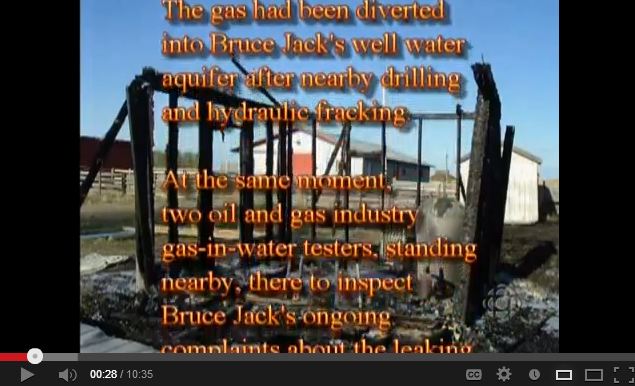
Encana/Ovintiv frac’d Rosebud Alberta to hell:
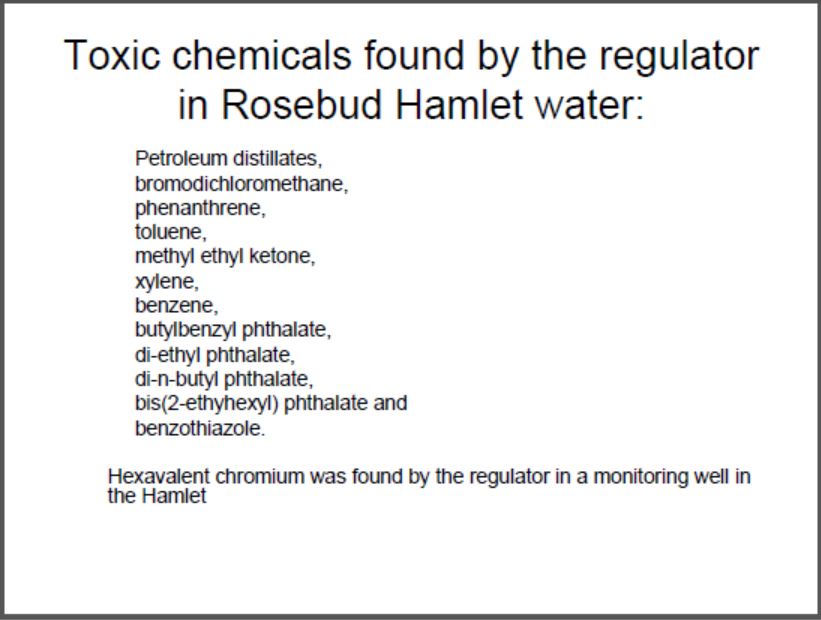
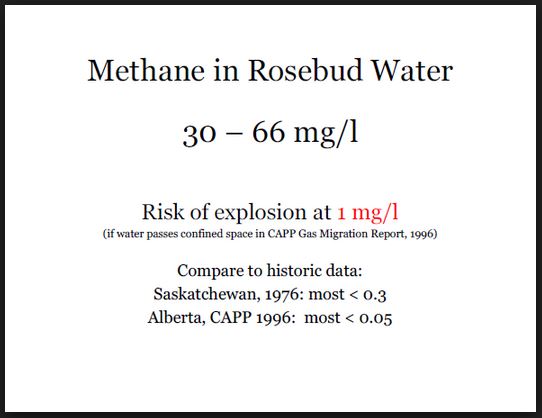
![]() Long after the above data was collected by Alberta’s water regulator, they finally released Debbie Signer’s (neighbour to the SW) methane contamination in her water at 110 mg/l but the fraudsters never warned her or any one else harmed by Encana.
Long after the above data was collected by Alberta’s water regulator, they finally released Debbie Signer’s (neighbour to the SW) methane contamination in her water at 110 mg/l but the fraudsters never warned her or any one else harmed by Encana.![]()
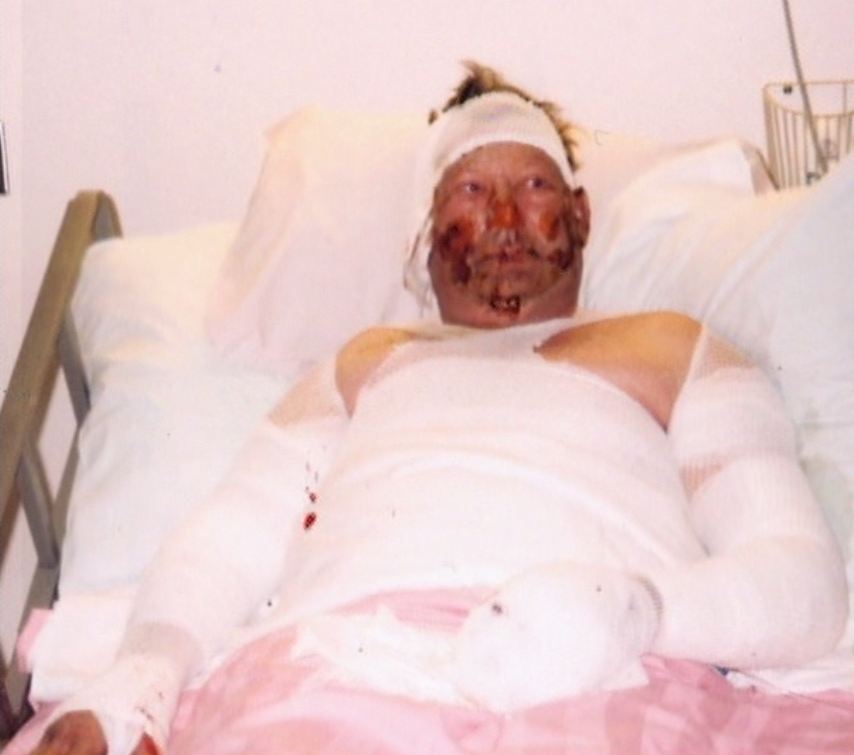
Photo by Colin Smith of my water after Encana/Ovintiv illegally frac’d directly into my community’s drinking water aquifers. Our regulators, gov’t and courts, and even my own lawyers, only punished me, severely. Evil Fucks.
![]()
EQT did not respond to a request for comment for this story.
The study concludes, based on evidence from New Freeport, that frack-outs — when fluid injected into the ground to fracture shale and release gas instead communicates with an abandoned well, sometimes arriving at the surface — can “result in widespread contamination” of underground water sources even well outside of currently regulated impact zones. The paper’s analysis found that “the extent of the contamination was wider than initially reported.”
“Here we have a situation that clearly demonstrates communication at 7,800 feet all the way to the surface,” said Stolz, a microbiology professor who specializes in water quality. Post-frack-out water chemistry clearly shows “through the presence of methane and other light hydrocarbons, that people no longer have potable water.”
Contamination far beyond regulated zone
The study cites Public Source reporting, published last year, that revealed video evidence of gas and fluid spewing from the ground on June 19, 2022, when the frack-out occurred, and workers observing a “direct correlation” between EQT’s fracking and an abandoned well in New Freeport.
EQT has publicly denied responsibility since the incident, arguing in filings to the state Environmental Hearing Board that there was “no evidence” to support that a communication incident had occurred. Confronted by residents in August 2023, CEO Toby Rice said he did not believe EQT was responsible.
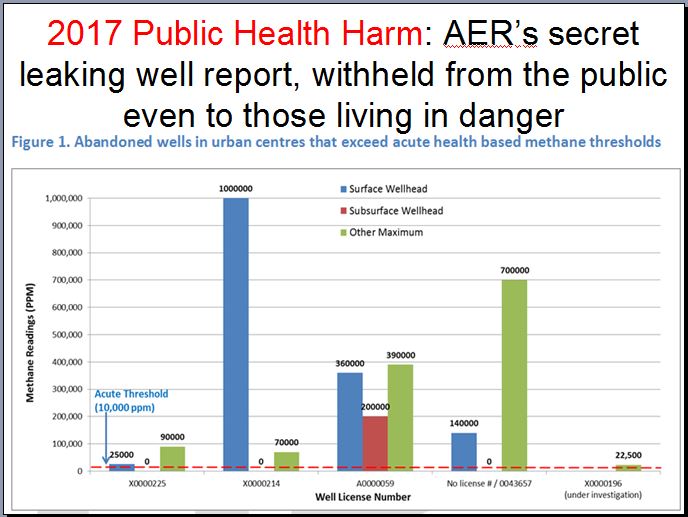
Stolz said his research also shows that current regulation is insufficient to protect communities. State law sets a “zone of presumption” of a 2,500-foot radius around wells, and says that fracking operators are required to provide residents in that circle with water after suspected contamination or water loss.![]() Albertans don’t even have that protection. Satan runs our politicians and authorities to always serve industry, even when companies violate every law in place to protect groundwater
Albertans don’t even have that protection. Satan runs our politicians and authorities to always serve industry, even when companies violate every law in place to protect groundwater![]() “The main area of impact [in New Freeport] is well out of the zone of presumption,” Stolz said. “And so therefore there’s no recourse for the harmed families.”
“The main area of impact [in New Freeport] is well out of the zone of presumption,” Stolz said. “And so therefore there’s no recourse for the harmed families.”
The study suggested that “at least a 5,000-foot buffer would be more appropriate.”

The zone of presumption was adopted before operators were drilling thousands of feet and injecting fluids at high pressures. The regulation “in no way contemplated the kind of drilling we’re seeing now,” said former state Department of Environmental Protection [DEP] Secretary David Hess. “It’s really an antiquated concept,” he added. “It really needs to be updated.”
“These people have a problem that is not their fault,” Hess said. “The government’s role should be to step in and fix it, to provide water until the problem is identified.” Instead, under current laws, the DEP is under no obligation to require EQT to provide water for people who are outside the zone of presumption. “They’re left out to dry until DEP has the resources to look into it,” Hess said.
A DEP spokesperson said the agency “will conduct a thorough investigation to determine whether the water supply has been affected” by drilling “regardless of a water supply’s location inside or outside of the zone of presumption.”
The DEP has investigated 24 cases in the New Freeport area to date, and has determined that those complaints of water issues were not related to fracking, according to the spokesperson. The DEP is currently investigating more recently submitted complaints.![]() I highly doubt frac’ers will let DEP adequately investigate, and I bet they will copy AER, and rule EQT’s frac fuckups are not to blame.
I highly doubt frac’ers will let DEP adequately investigate, and I bet they will copy AER, and rule EQT’s frac fuckups are not to blame.![]()
EQT is providing water to some area residents, and nearly every home along Main Street in New Freeport is connected to a large tank of water, refilled weekly. ![]() The unfairness in frac fields as to who gets water and who doesn’t is gruesome. I am left out to dry, while an oil company VP and lawyer working for oil and gas companies and living rural with methane contaminated water at much lower concentrations than in my water, received water without question, and in secret. A hydrogeologist working on those contamination cases told me, but would not go public as is the cowardly way in raped to hell Canada.
The unfairness in frac fields as to who gets water and who doesn’t is gruesome. I am left out to dry, while an oil company VP and lawyer working for oil and gas companies and living rural with methane contaminated water at much lower concentrations than in my water, received water without question, and in secret. A hydrogeologist working on those contamination cases told me, but would not go public as is the cowardly way in raped to hell Canada.![]()
In November 2023, EQT mailed residents letters, offering to install water treatment systems or to continue supplying water, in exchange for non-disclosure agreements barring residents from publicizing the arrangement or disparaging EQT, and absolving EQT from future liability for property damage or personal injury.
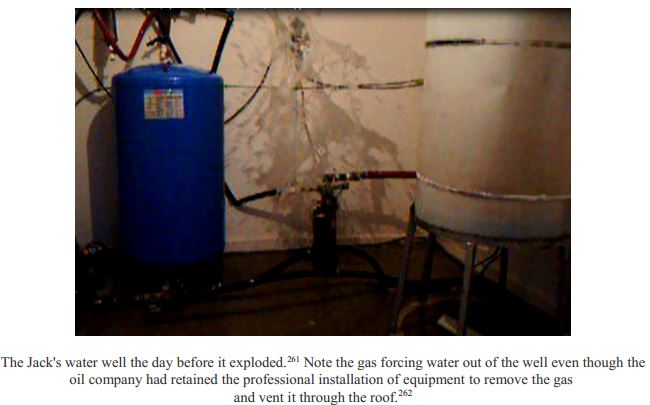
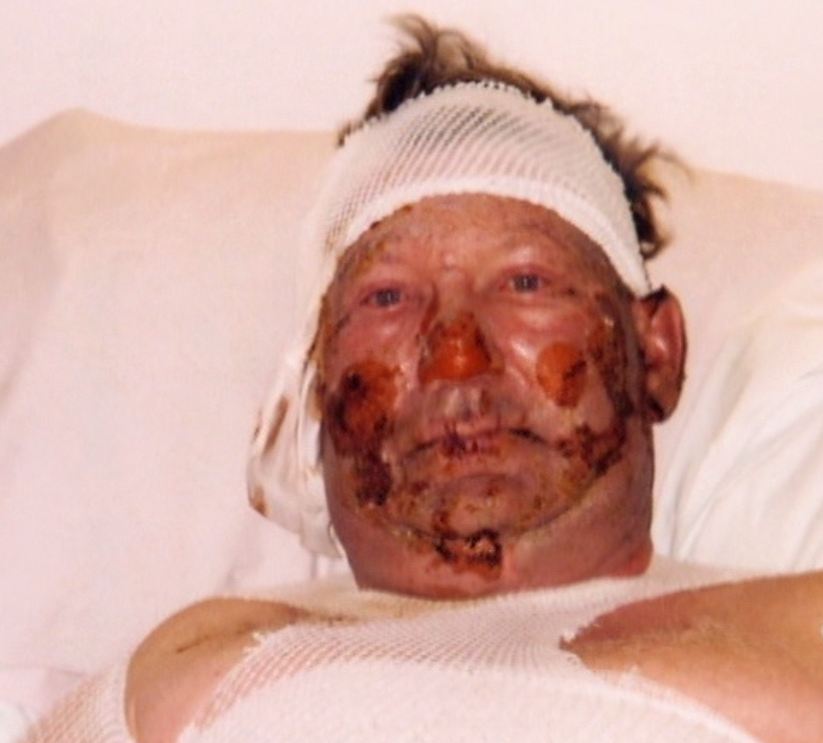
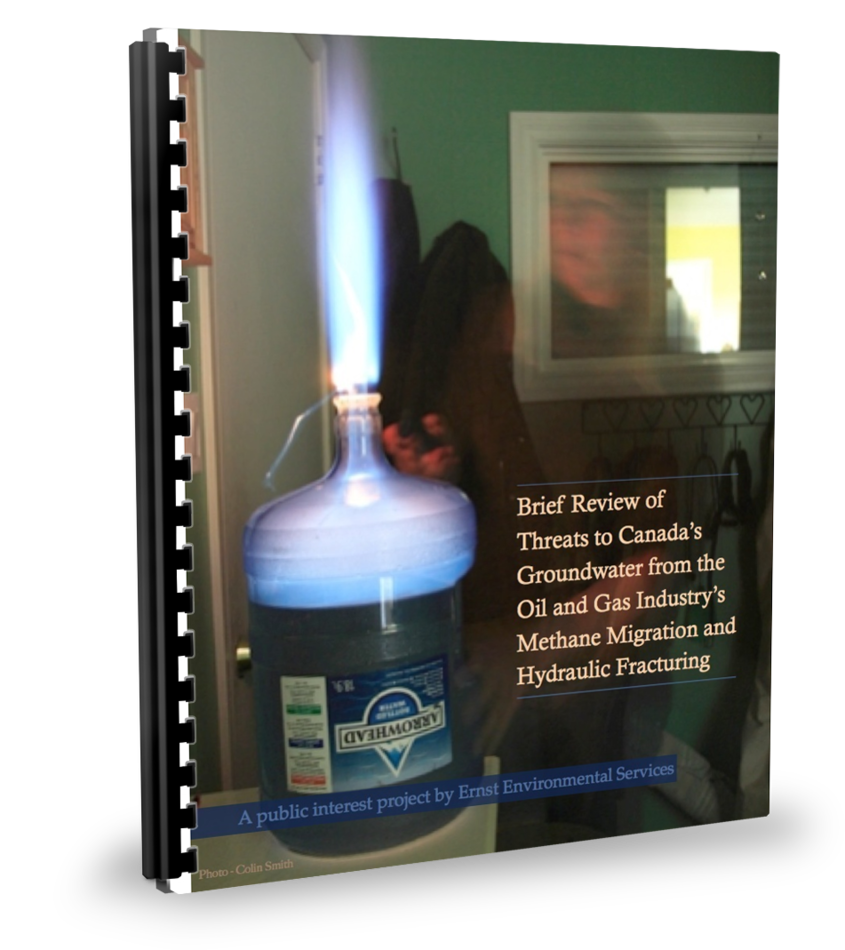
![]() Treating to remove health damaging, life-threatening explosive frac’d gasses in drinking water, such as methane and ethane, propane, butane, H2S, etc., is impossible and can kill you and or your loved ones. The same system was urged on Bruce Jack of Spirit River Alberta with the success of the system shown in photos below. Treatment of such gasses is impossible because the source – the frac’d and contaminated subsurface cannot be and is never treated, only the contaminated water entering the system getting it into the home, business, care home, or hospital etc., can be treated. And, the fucking frac’ers and their crime enablers DEP, AER, Alberta Environment, et al., sodding well know it.
Treating to remove health damaging, life-threatening explosive frac’d gasses in drinking water, such as methane and ethane, propane, butane, H2S, etc., is impossible and can kill you and or your loved ones. The same system was urged on Bruce Jack of Spirit River Alberta with the success of the system shown in photos below. Treatment of such gasses is impossible because the source – the frac’d and contaminated subsurface cannot be and is never treated, only the contaminated water entering the system getting it into the home, business, care home, or hospital etc., can be treated. And, the fucking frac’ers and their crime enablers DEP, AER, Alberta Environment, et al., sodding well know it.
2006:
![]()
Dispelling ‘myths of the Marcellus’
Stolz said he’s spent over 15 years trying to address the question: Does fracking impact sources of water?![]() He could have asked me twenty years ago, or read my 2013 brief, or read Nikiforuk’s Slick Water (2015)
He could have asked me twenty years ago, or read my 2013 brief, or read Nikiforuk’s Slick Water (2015)![]()
Wednesday’s research, Stolz said, dispels two “myths of the Marcellus,” proving that fracking can and does contaminate groundwater, and casting doubt on the industry contention that “what goes on at 8,000 feet [below ground] does not impact the surface.”![]() Frac’ing in the USA and Canada does not just happen deep, companies intentionally frac shallow directly and repeatedly into drinking water sources such as in Pavillion Wy, Rosebud Alberta, and with waste injection in California and Texas.
Frac’ing in the USA and Canada does not just happen deep, companies intentionally frac shallow directly and repeatedly into drinking water sources such as in Pavillion Wy, Rosebud Alberta, and with waste injection in California and Texas.![]()
The research also found that communication events occur at roughly 1% of wells in Pennsylvania, based on DEP data.
“Residents should feel a lot of validation,” said Sarah Martik, executive director of the Center for Coalfield Justice, which has supported residents by distributing water![]() No NGO or church did that in Alberta!
No NGO or church did that in Alberta!![]() , hosting town hall meetings and contacting local elected officials since the incident. “Clearly there is something happening in that aquifer.”
, hosting town hall meetings and contacting local elected officials since the incident. “Clearly there is something happening in that aquifer.”
Martik said the organization has continued to receive new reports of contamination, and more residents coming out to public meetings.
“The watershed continues to be at risk,” said Stolz, and EQT continues to frack in the area.![]() Same in water contaminated communities in Alberta. Rosebud is set to be frac’d to hell anew by Persist Oil and Gas, a scheister bit coin frac’er for sour oil. The human species is despicable in many more ways than one.
Same in water contaminated communities in Alberta. Rosebud is set to be frac’d to hell anew by Persist Oil and Gas, a scheister bit coin frac’er for sour oil. The human species is despicable in many more ways than one.![]()

State of emergency declared
The latest research comes as local officials sound the alarm. In June, the Freeport Township Board of Supervisors declared a state of emergency.
“A contamination event caused by actions of EQT has caused or threatens to cause injury, damage and suffering to persons and property of Freeport Township,” the declaration reads. It notes:
- The lack of public water in the rural town
- Testing that shows contamination
- Warnings to the DEP and EQT that the “water is hazardous and unsafe for use”
- Resident reports of discoloration, odor and skin rashes after using water from private wells.
In August, neighboring Springhill Township declared a similar emergency.
Freeport Township Supervisor Tim Brady said the disaster declaration “was a last resort,” adding that it opens up access to state and federal grants that could help bring clean water to the community. The goal, he said, is to fund a public water line that would run roughly 13 miles from Rogersville to New Freeport and would cost roughly $12 to $15 million.
Brady did not know, though, if EQT would contribute to that cost or if it might fall entirely on the Pennsylvania taxpayer.
“They’re still drilling,” he said, “They haven’t slowed down any. The DEP gives them permits left and right.”![]() Alberta’s self regulator of frac’ers does the same
Alberta’s self regulator of frac’ers does the same![]()
Regardless, he said, bringing public water to the community will take time: “We all know how government moves,” Brady said.
“We’re not going to have water for seven to eight years. We’re forgotten out here.”![]() I’ve not had safe water for 20 years I expect I will die before any authority makes it right, and fixes my frac’d water or replaces it appropriately.
I’ve not had safe water for 20 years I expect I will die before any authority makes it right, and fixes my frac’d water or replaces it appropriately.![]()
Preliminary injunction denied
A class-action lawsuit filed by residents of New Freeport against EQT in June 2024 sought injunctive relief for affected residents, asking a judge to order EQT to provide clean water.
Plaintiffs asked the court to demand that EQT provide a plan to supply safe drinking water to area residents who are already receiving water from the company and others who may request that service. The plaintiffs asked EQT to voluntarily provide water to roughly 600 potentially impacted residents, but “EQT refused,” according to the motion. The attorneys added in the filing that EQT reported 2022 operating revenues of $7.5 billion.

“It is difficult and hectic to have to buy water for ourselves constantly,” wrote New Freeport resident Bill Yoders in a signed affidavit accompanying the motion for an injunction. “It has been a struggle financially. We would not be able to afford continued weekly water delivery for our home.”
Nearly a year later, U.S. District Judge W. Scott Hardy, of the Western District of Pennsylvania, denied the request on Aug. 26, writing that the plaintiffs are not “experiencing immediate irreparable harm,” and that evidence “does not show that the harms at stake in this suit cannot be addressed by money damages.”
Counsel for the plaintiffs are appealing the decision.
Editor’s note (9/17): Comments received after initial publication of this story have been added.
Quinn Glabicki is the environment and climate reporter at Pittsburgh’s Public Source. He can be reached at email hidden; JavaScript is required and on Instagram @quinnglabicki.
Contamination of private water supplies after a well communication event (frac-out) in southwest Pennsylvania by Tetiana Cantlay, Daniel J. Bain, Christopher Dombrowski, Michael Rykaceski, Mikayla Bayto, Kiley Miller & John F. Stolz, Sept 17, 2025, Nature
Scientific Reports volume 15, Article number: 32352 (2025)
Abstract
The proliferation of unconventional oil and gas development over the last two decades has raised concerns about impacts to surface and ground waters. Contamination associated with hydraulic fracturing introduces hydrocarbons and other harmful pollutants to drinking water sources. In this study, we evaluated the impact of a well communication event (frac-out) that occurred on June 19, 2022, in New Freeport, Pennsylvania. Over two years, 75 residential well and surface water samples were collected from surrounding areas and analyzed for anions, cations, and light hydrocarbons. Each sample was then assigned a Multi-component Contamination Index (MCI) (on a scale of 0–6) based on mass ratio space analysis (Ca/Sr, Br/SO4, SO4/Cl, Mg/Na, Mg/Li) and presence of light hydrocarbons (i.e., methane, ethane, and propane) to assess the level of impact. Results revealed evidence for oil and gas brine contributions to water chemistries as well as fugitive methane with 62% of the well water samples having an MCI greater than 4. 71% had methane, with 19% above 10 ppm. Geospatial analysis determined the extent of the contamination was wider than initially reported. Our results verify that unintended communication events can result in widespread contamination of subsurface water sources broader than current regulatory specified impact zones.
Introduction
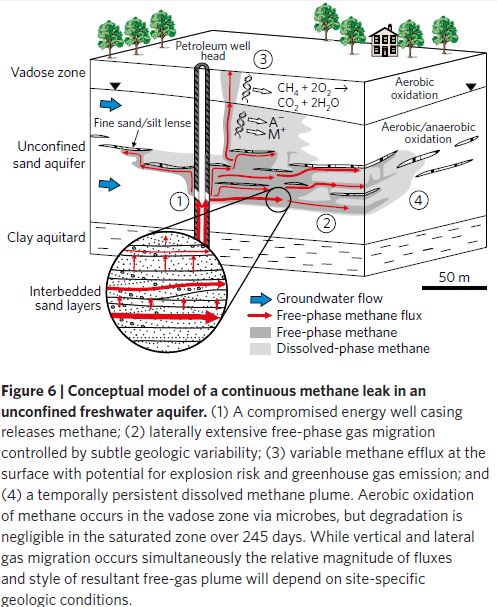
Tight oil and gas shales are substantial reserves for global energy production. The US Energy Information Administration estimates 419 billion barrels (66.6 trillion liters) and 7,577 trillion cubic feet (215 trillion cubic meters) of oil and gas respectively1. The development of tight shales became feasible by combining horizontal (directional) drilling with hydraulic fracturing. Although unconventional deposits where oil and gas are extracted are usually a few thousands of meters deep, there are situations that affect the overlying strata up to the surface. The term “frac-out” has evolved to refer to the inadvertent return of fracturing fluids/shale brines mixes to the Earth’s surface (also referred to as a “fracture hit” or “frac hit”)2. Frac-outs generally occur when hydraulically fractured wells interact with fracture networks or existing horizontal wellbores. Frac-outs may occur more frequently as wellbores are drilled more densely and with longer laterals3,4,5 increasing potential interactions with geologic structures and historical wells, particularly hard-to-detect orphaned and abandoned wells6,7.
Frac-outs are relatively rare (or not well publicized) but do occur. To illustrate, the Pennsylvania Department of Environmental Protection (PA DEP) has documented 54 communication incidents within Pennsylvania between January 2016 and May 20248. When compared with the number of wells hydraulically fractured during that period, frac-outs occurred in roughly 1% of those wells (there are spud dates for 4,841 unconventional wells between 1/1/2016 and 5/31/2024 in Pennsylvania)9. If this rate is applied (albeit naively) to US hydraulic fracturing activity, in a typical year (14 thousand directional/horizontal wells per year)10 there should be roughly 140 frac-outs per year across the US, or a frac-out every 2–3 days. While infrequent, frac-outs are impactful, as fluids are forced across and through a much larger zone than that typical of a well causing failure or liquid tank release. The environmental impacts of a frac-out currently have not been documented in the literature.
The ambiguous spatial footprint of a frac-out exacerbates challenges in the use of geochemical tracers to examine the extent of water quality impacts. Fracturing fluids used during hydraulic fracturing are a complex solution of chemicals and proppants that remain uncertain due to exemptions from water quality regulations1,11. During hydraulic fracturing the fracturing fluid interacts with shale brines, waters with highly variable mixes of elevated salinity (sodium, chloride, and bromide), trace metal constituents (barium and strontium), and materials to trace produced water. Elevated bromide concentrations are a potentially powerful indicator of brine12 however, conventional oil and gas (O&G) brines can also contain elevated bromide making source attribution more difficult13. Barium (Ba) and lithium (Li) are also commonly elevated in brine impacted waters14,15,16. Yet, Br, Ba, and Li are not necessarily part of typical water quality monitoring constituent suites and, when they are included, are measured with poor sensitivity, limiting our ability to identify contamination17. Some tracers that provide increasing clarity (e.g., Ra-228 to Ra-226 ratios in NORM)18,19 strongly partition onto solid phases in freshwater environments, limiting their use as a water tracer20.
Methane content in the water can indicate connection with hydraulic fracturing activities16,21. While there may be multiple sources for the methane found in domestic wells (i.e., biogenic![]() Companies, including Encana at Rosebud, frac’d intentionally shallow targetting biogenic methane and when waters wells using those aqufiers are contaminated, Encana and authorities blame nature, and if that doesn’t ring true enough to the astonished public, blame the water well owners, and if that doesn’t work, regulators judge the harmed “criminals” then “terrorists” without any evidence and without even letting the harmed know they are being judged.
Companies, including Encana at Rosebud, frac’d intentionally shallow targetting biogenic methane and when waters wells using those aqufiers are contaminated, Encana and authorities blame nature, and if that doesn’t ring true enough to the astonished public, blame the water well owners, and if that doesn’t work, regulators judge the harmed “criminals” then “terrorists” without any evidence and without even letting the harmed know they are being judged.![]() and thermogenic)22 any of these potential sources can be mobilized and transported to the surface in a frac-out event. Together, these ambiguities can obscure water quality impacts from oil and gas sources in a frac-out. Simple, straightforward approaches to apportioning shale gas contamination remain a research priority.
and thermogenic)22 any of these potential sources can be mobilized and transported to the surface in a frac-out event. Together, these ambiguities can obscure water quality impacts from oil and gas sources in a frac-out. Simple, straightforward approaches to apportioning shale gas contamination remain a research priority.
Accurate attribution of contamination to likely sources is also fundamentally challenging in areas with a long history of fossil fuel extraction activities. The mixing of various distinct, but overlapping, inputs create complex and ambiguous contamination patterns. For example, acid mine drainage is typically characterized by high acidity and elevated sulfate concentrations, along with dissolved heavy metals and metalloids such as iron, manganese, copper, zinc, cadmium, and arsenic23. Both conventional and unconventional produced waters are rich in salts, contain naturally occurring radioactive materials (NORM), and various organic compounds, but unconventional produced water can be significantly more saline and may contain potentially hazardous chemicals from hydraulic fracturing fluids24. When these potential sources are mixed, the permutations of potential chemistries are difficult to disentangle, and potential source attributions may suffer from equifinality. This is exacerbated by the tendency to tune monitoring to specific impacts. For instance, acidic mine drainage testing often relies on parameters such as sulfate, iron, manganese, and aluminum. Therefore, historical data from mine drainage analyses provide limited, if any, insight into historical brine contamination. Moreover, there are waste streams from other pertinent processes that remain very poorly characterized (e.g., coal bed methane waste), further obscuring accurate source apportionment. Together, these conditions make chemical tracers even harder to apply in energy extraction landscapes.
The poorly characterized subsurface architecture impedes our ability to predict or often even reconstruct transport flow paths. Consider, we have multiple sets of LiDAR imagery for western Pennsylvania over the last twenty years25,26 while the most recent systematic documentation of shallow sub-surface conditions at the study site is almost forty years old27. Details presented in the groundwater reporting are much coarser resolution27. Though all hydrogeologic settings tend to have their complexities, a cycle of water flow concentrating in fracture zones, leading to incision and increased stress release, and ultimately further fracturing, has led to tight connections between fractured rock and drainage networks in the Appalachian Plateau28,29. Moreover, in southwestern Pennsylvania, many of the stream valleys are buried with alluvium, further obscuring subsurface architecture and, at the same time, creating flow systems through the resulting riparian aquifers. This regional conceptual hydrogeology is generally accepted, however, neither the depths of the valley fracture zone nor the thickness of the valley fill is well documented. When combined, there is a higher probability that valley groundwaters may interact with deeper flow paths or fracture zones, and, once contaminants reach the valley riparian aquifer, relatively quicker subsurface transport through the valley fill. The interaction of a well communication event with this hydrogeologic system has strong potential to generate complicated contamination patterns. Fundamentally, it makes it difficult to precisely define the flow paths connecting preferential flow paths (e.g., abandoned wells) with the much deeper strata that are being fractured.
Given the nebulous source attribution and complicated hydrogeology, regulatory agencies often rely on spatial extents as a proxy for potential water quality impacts. For example, in Pennsylvania, a buffer of 2,500 feet (762 m) around an unconventional vertical wellbore is the “zone of presumption” wherein degraded water quality is presumed to result from the extraction activities as described in Sect. 3218(c), Title 5830. However, these simple geometries are not sufficient for events like a frac-out, where fluids can be forced toward the surface through multiple flow paths. In such cases, no point or set of points can serve as the center of a similar buffer and water quality impacts can occur far from the well pad (unconventional horizontal borings typically stretch for kilometers)31,32. The potentially broad spatial extent of frac-out impacts, when coupled with spatially precise zones of presumption, results in water sources impacted by the frac-out potentially being excluded from regulatory scrutiny.
This study examines the water quality implications to shallow groundwater sources following a frac-out that occurred in New Freeport, PA (June 19th, 2022)33,34. Private water wells were sampled and water chemistry (i.e., anions, cations and light hydrocarbons) was characterized. Water chemistries were aggregated into a Multi-component Contamination Index (MCI) and used to evaluate the spatial patterns of potential impact. The patterns described here underline the complexities of water quality impacts and demonstrate the need for additional regulatory tools that protect human and ecosystem health following a frac-out.
Methods
Sampling
Seventy-five surface and ground water samples were collected following the procedures described in Cantlay et al.13. Participants in this study were recruited in coordination with the Center for Coalfield Justice, during town meetings, and through personal contacts. Each sample was assigned an “MS” number to protect participant anonymity, in accordance with the approved Institutional Review Board protocol.
Water wells were purged prior to any filtration or treatment for 10–20 min depending on the flow and volume (e.g. some wells can run dry and will not yield water for that length of time). Samples were collected directly from either a sink or outdoor faucet, and prior to any treatment (e.g., water softener). Water temperature, dissolved oxygen, pH, and specific conductivity were measured in the field using a YSI Professional Plus multimeter (Fondriest Environmental Products, Yellow Springs, OH). Anion sample splits were collected in sterile 1 L French square glass bottles and cation sample splits in 60 ml French square glass bottles with 10 drops of 10 M nitric acid added to the bottle in the lab before departing to the field. Samples for light hydrocarbon analysis were collected without headspace in 40 mL EPA Volatile Organic Compounds (VOC) butyl septa vials. All samples were stored on ice (4℃) and in the dark until processing.
Water chemistry analysis
Sample preparation for cation and anion analysis was conducted following the methods outlined in Cantlay et al.13,35. Anions were measured using a Dionex ICS-1100 equipped with a DS6 heated conductivity cell and a DAD-3000 UltiMate 3000 Diode Array programmable ultraviolet-visible (UV/VIS) detector (Thermo-Fisher, Sunnyvale CA). Cations were measured using a Perkin Elmer NexION X300 Inductively Coupled Plasma Mass Spectrometer (ICP-MS) with a Perkin Elmer S10 autosampler.
Light hydrocarbons (methane, ethane, ethane and propane) were measured using a Shimadzu Nexis gas chromatograph GC-2030AF (Columbia, MD, USA) equipped with an HS-20 Headspace Autosampler and a flame ionization detector (FID). The method for this analysis was a modification of RSK-17536. Instrument measurements were analyzed using LabSolutions Shimadzu software. Certified Reference Material for Dissolved Gas Analysis: methane, ethane, ethene, and propane (5 mg/L in water, LGC Standards (Manchester, NH, USA)) was used both for preparation of calibration standards and as a laboratory control sample. The detection limits were 10 μg/L for each target analyte. To ensure the linearity in the calibration curves, two ranges were used: the low calibration range covered concentrations from 10 to 500 μg/L and the high calibration range covered calibrations from 500 to 5,000 μg/L. Samples exceeding 5,000 μg/L were diluted accordingly to concentrations within the high calibration range.
Mass ratio analysis was employed to characterize chemistry and evaluate the source of dissolved chemistry in surface and ground water samples. These mass ratio spaces were utilized: Mg/Li vs. Br/SO4, Mg/Li vs. SO4/Cl, and SO4/Cl vs. Mg/Na described by Cantlay et al.14 and Ca/Mg vs. Ca/Sr from Tisherman et al.37 augmented with source information from sample and literature data from Cantlay et al.14 These mass ratio spaces are defined by clusters of ratios typical of three contamination sources: conventional O&G brines, unconventional gas brines, and mine drainage14.
Statistical analysis
Statistical analysis for composition ratio plots was generated using Origin 2018b software (Origin Lab, Northampton, Massachusetts). Data points were grouped based on clustering. One-way analysis of variance (ANOVA) was used to determine the statistical differences among distinct clusters representing various contamination sources for different mass ratio spaces (Ca/Sr vs. Ca/Mg, Mg/Li vs. Br/SO4, Mg/Li vs. SO4/Cl, and SO4/Cl vs. Mg/Na)14 and for groups of water samples affected/not affected by a pollution source. The analysis showed that, at the 0.05 significance level, the population means of all samples within the clusters were significantly different (P value < 0.001).
Differences between samples collected within set buffers of the Fox Hill #1 well and those collected outside the buffer were compared using the two-tail Wilcoxon rank sum test (⍺=0.05) in R38. In cases where there were substantial numbers of non-detects (i.e., greater than 7%) the test was run with only detections and also with all non-detects set to zero.
Geospatial analysis
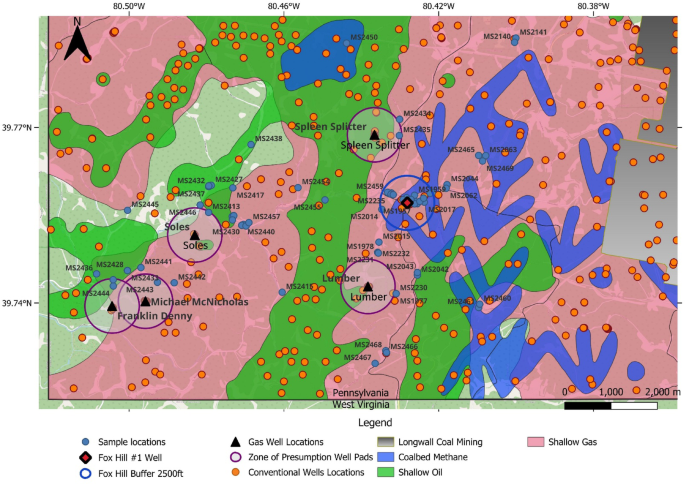
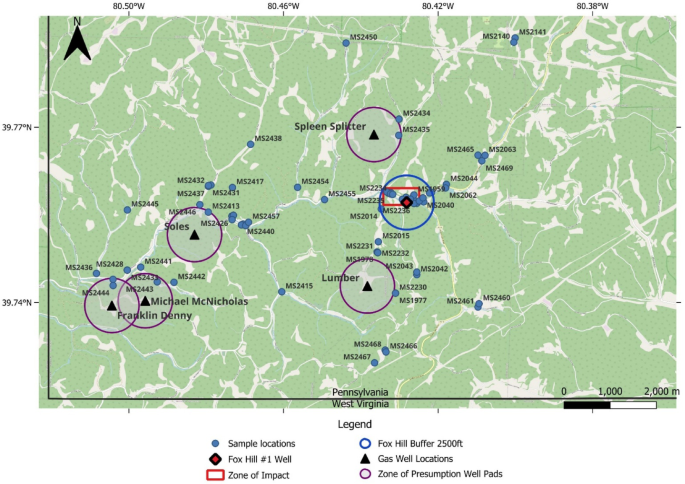
Geospatial analysis was conducted using QGIS 3.34.339. Sample locations were mapped along with the well pad locations. The latter included the delineation of the 2,500 feet (762 m) zone of presumption (Sect. 3218(c), Title 58) (Fig. 1)30.
Multi-component contamination index (MCI)
Given that water flow during frac-outs can force legacy contaminated water to the surface and/or can force water through contaminated zones in the subsurface, water chemistries can appear contaminated based on some criteria but not in others. Here, we evaluated the data using a preponderance of the evidence approach. That is, we used the available data to calculate the MCI, where the index is the sum of the cases where the samples are considered by each criterion to be contaminated (below threshold values Ca/Sr = 100, Mg/Na = 0.15. SO4/Cl = 0.6, Mg/Li = 1100 or containing CH4 and/or Br). Each chemical criterion is examined separately and if a sample is considered “contaminated” it is assigned a value of 1 for that criterion. If a sample was considered “non-contaminated” it was assigned a value of 0 for that criterion (Supplementary Table S1, Fig. 7). Then, the values for each sample were summed across all ratios and methane. Finally, the values for each sample were summed across all ratios, methane and bromide. If a sample had a sum that is ≥ 3 (i.e., at least half of the 6 measures) the sample was considered impacted by oil and gas brine.
Ethics approval and consent to participate
The ethical clearance for this study was granted by the Duquesne University Institutional Review Board (Protocol # 2019/01/14). All methods and data collection were performed in accordance with the relevant guidelines and regulations. Participants were duly informed about the study, and informed consent was obtained from all of them. The basic ethical principles of voluntary participation, informed consent, anonymity and confidentiality of respondents were complied with during data collection, analysis and reporting. All data was de-identified by assigning an “MS” number to maintain the anonymity of the study participants in compliance with the approved institutional Review Board protocol.
Results and discussions
Study area
New Freeport (Pennsylvania, USA) sits upon the Greene Formation (Fig. 1), a set of sedimentary sequences of sandstone, shale, red beds, thin limestone, and thin, impure coal40. Coal mining and conventional oil and gas extraction are central to the local economy (Fig. 1)41,42. The extraction from the Marcellus Shale has led to rapid development of hydraulic fracturing in the county. The PA DEP issued a total of 5,085 permits, of which 4,727 were for gas wells, between January 1, 2005, and September 12, 2024, in Greene County43. In addition, 237 coalbed methane permits and 43 conventional oil well permits were issued during this time period43.
Timeline of frac-out events
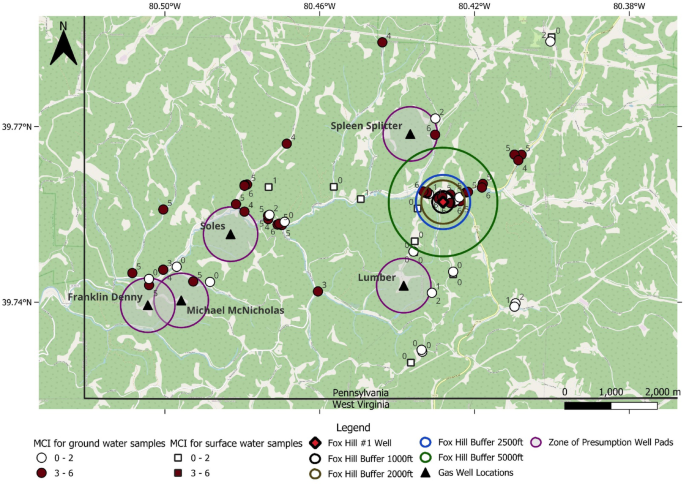
On June 19, 2022, a “frac-out” occurred at the Lumber pad in New Freeport Pennsylvania47 (Figs. 2, 3 and 4). At the time, multiple laterals were being fracked simultaneously (1H, 5H, 11H, 13H, and 15H)46 (Fig. 5). The operator was in the 100th stage of hydraulically stimulating or fracking 13H at a depth of 7,820’ (2383.5 m) and a distance of ~ 6,500’ (1981 m) from the wellhead (Fig. 5) when the fracking process “communicated” with an abandoned conventional gas well, later identified as Fox Hill #1, 3,200’ (975 m) away from the lateral.
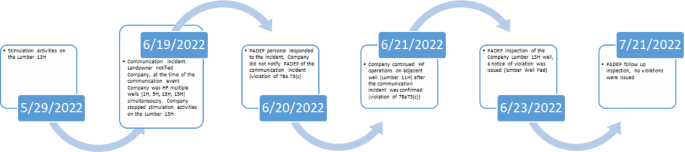
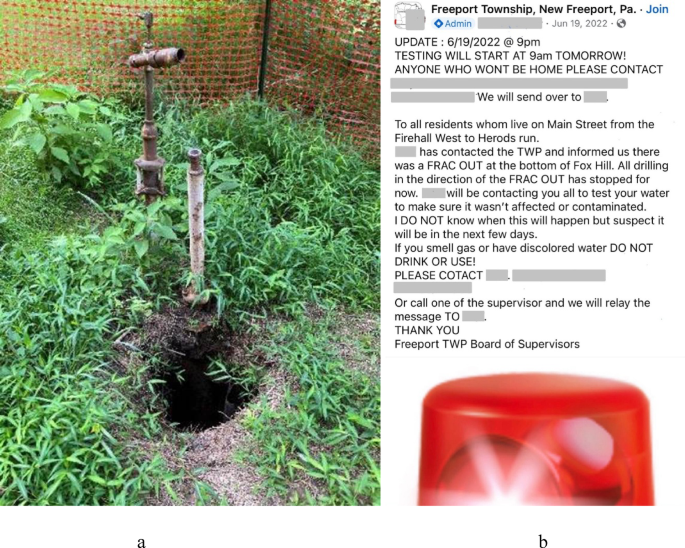
The event sent a fountain of fluids, mud, and gas spewing from the surface46. The operator was notified of the incident by the landowner of the parcel where frac-out fluids reached the land surface. The frac-out created a sinkhole where pressure forced fluids to the surface through an abandoned conventional well (Fox Hill #1, Fig. 4). The community was then alerted of the incident through a Facebook post by the township supervisors advising people not to use their water (Fig. 4). The “Zone of Impact” as designated by the operator was reported in the post as “Main Street from the Firehall west to Herod’s Run” (Figs. 2 and 4)48. Once the frac-out had been discovered, hydraulic stimulation of 13 H was halted, but fracking continued in the adjacent lateral (11 H)46. All drilling activity on the Lumber pad ceased on June 22, 202246. The PA DEP issued several violations including failure to report the frac-out and continuing the fracking after the incident47. The company appealed fracking stoppage in September of 2023 and reached a settlement with the PA Environmental Hearing Board (EHB) in late November (PA EHB Case number 2023071). Fracking recommenced in mid-December but shut down again in January of 2024 after a “microseismical event”34. The well shut down again in February of 202434. The first well water samples reported here were collected on June 27, 2022, with additional samples collected on 14 trips through February 2024. The sampling period covers several years, and this duration may limit inter-sample comparability. Most early sampling was focused in the area surrounding the zone of impact. Later sampling included a much larger zone of interest (Fig. 2). The majority of the water wells lie outside of the “zone of presumption” for the Lumber pad (Fig. 2).
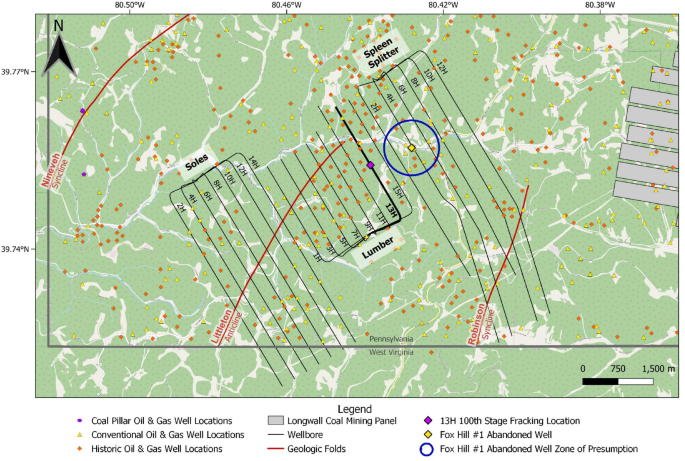
In the areas surrounding New Freeport, the extent of historical energy extraction is substantial. In the 110 square kilometer portion of Pennsylvania shown in Fig. 5, there are 580 conventional O&G wells (i.e., the sum of “conventional” and “historical” wells, assuming historical wells are almost entirely conventional) and 3 coal pillar O&G wells. Pillar O&G wells are a special type of well where the vertical portion of a directional boring is routed through a coal pillar left in to support the entries surrounding a long wall coal mining panel or the rooms in a room and pillar system49. While there is no mining underneath New Freeport given the depth of the Pittsburgh Coal Seam in this area (224 m), the Blacksville #2/Monongalia mine lies directly east of New Freeport (Fig. 5). The horizontal borings used in the hydraulic fracturing are present below much of New Freeport (Fig. 5). The locations of recent activity (i.e., long wall mining and horizontal drilling) are well documented. However, historical activity is sometimes not documented at all, and these ambiguities in extraction infrastructure can lead to events like a frac-out6,7.
Ratio spaces analysis of new freeport sample water chemistries
New Freeport water samples cluster into two distinct zones in the Ca/Sr vs. Ca/Mg mass ratio space (Fig. 6a), divided by a Ca/Sr ratio ~ 100. Tisherman et al.37 identified that samples with Ca/Sr ratios above 100 are non-impacted by O&G activities. One-way ANOVA confirmed these clusters were statistically different (P value < 0.001). Among the 75 samples, 45 samples were in the impacted cluster, while the remaining 30 were in the non-impacted cluster.
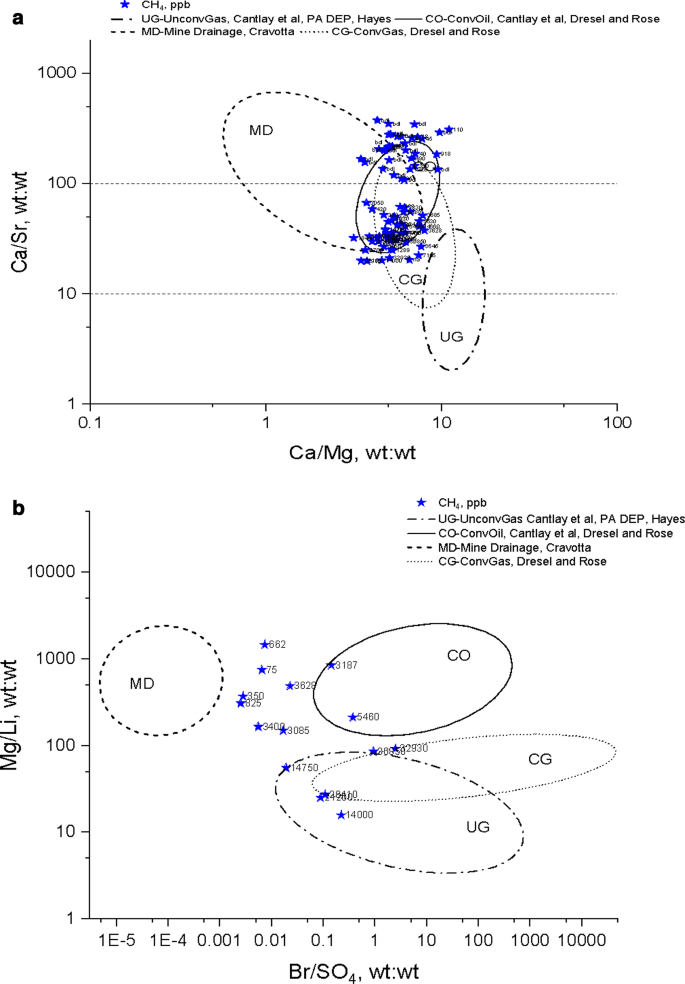
In other mass ratio spaces (Fig. 6b, c, d) the data did not clearly cluster in ratio cross plot spaces. In these cases, samples were divided into two groups according to apparent separation lines between impacted and non-impacted samples for both ratios in the plots. Samples with SO4/Cl mass ratios below 0.6 (Fig. 6c), samples with Mg/Li mass ratios below 1100 (Fig. 6c), and samples with Mg/Na mass ratios below 0.15 (Fig. 6d) were considered to be impacted by O&G brines14. Samples in the Mg/Li vs. Br/SO4 mass ratio space were more limited than other spaces, largely due to fewer detections of Br (Fig. 6b). Therefore, for this ratio space, any sample with detectable Br is considered “contaminated” for purposes of the MCI.
Attribution of water contamination to a specific source is a challenge, particularly when examining landscapes with substantial legacy contamination37,50. Further, given the retrospective nature of most impact assessments, it is often challenging to establish a good base line chemistry. Frac-outs exacerbate this challenge, introducing additional uncertainty. Therefore, we utilized the MCI to examine patterns of contamination. Of the samples with an MCI ≥ 3, most samples had MCI 5–6. Only 20% of samples had MCI 3–4 (Supplementary Table S1, Fig. 7).
VOC analysis in ratio cross plot spaces
Out of 75 collected samples, 53 (71%) had methane, 28 (37%) had ethane and 9 (12%) had propane. Almost all of the samples (98%) with an MCI ≥ 3 contained methane while only 32% of the samples with an MCI < 3 contained methane. No samples with an MCI < 3 had methane concentration above 3 ppm nor contained either ethane or propane. 32% of the samples with an MCI ≥ 3 had methane concentration above 10 ppm. The three samples that had an MCI of 6 also all had methane concentration above 28 ppm. This concentration could lead to the release of methane into indoor air in amounts that are potentially flammable in confined spaces. The U.S. Department of Interior warns users when methane concentrations in water exceed 10 ppm46. Methane contaminated samples were primarily located in valleys (Supplementary Fig. S1a), consistent with samples with higher MCI values (Fig. 7, Supplementary Fig. S1b).
“Impacted” samples (i.e., MCI ≥ 3) are more commonly located in valley settings (i.e., 39 samples out of 44 with MCI ≥ 3 were in the valley). While valley settings would be slightly vertically closer to the wells being fractured, given the depth of the process (e.g., 2380 m was the depth of hydraulic fracturing when the frac-out occurred), the local regional relief of 153 m is a small difference. However, it is also the case that drainage networks in southwestern Pennsylvania are closely associated with fracture zones28,29. These shallow fracture zones provide pathways for frac-out driven fluids laterally up and down the valley. The large number of impacted waters in valley positions suggest that material mobilized during the frac-out or other contamination events may have interacted with fractures to focus water quality impacts in valleys.
With the wider sampling that has occurred since the frac-out, there are locations where the MCI indicates oil and gas brine contamination that are sometimes kilometers distant from the operator-defined “zone of impact.” While the distance between the frac-out location and the Fox Hill #1 well suggests communication spanned at least 0.5 km of distance at the Earth’s surface, it is difficult to attribute these more distant incidents directly to the June 2022 event. First, though coal mining is likely too deep for mine drainage to be commonly communicating with shallow groundwaters, there is a long history of conventional oil and gas extraction and coal bed methane extraction. New Freeport and the “zone of impact” sit directly above a zone of coal bed methane extraction (Figs. 1 and 2). Coal bed methane extraction is unlikely to have created preferential flow paths for frac-out liquids, the process could easily have redistributed contaminants in unexpected ways (for example, the extraction well near New Freeport collected methane from coals stretching across > 200 m of stratigraphy). There are numerous active and historical conventional oil and gas wells across the study area (Fig. 1). These operations all could have historical or ongoing waste issues that can muddy the waters. The elevated MCI observed in MS2450 (MCI = 4) is hard to attribute to the frac-out event. Pushing brine that far up a tributary valley does not seem likely and there is no indication of other subsurface flow paths connecting the Lumber 13 H lateral and this location. However, in 2017, there was a release of oil and gas brine near this site from a well plugged in 1991. This release occurred when the installation of unconventional wastewater infrastructure (a brine collection pipeline) disrupted legacy conventional oil and gas wastewater infrastructure (a drip line) and discharged brine to the surface and subsurface51. Similarly, the cluster of samples with high MCI values east of the Soles well zone of presumption is close to a conventional well site that was cited in 2023 for multiple apparent releases right onto the floodplain of the Pennsylvania Fork of Fish Creek52. In both cases, these releases have the potential to contaminate ground waters with a suite of contaminants that would result in a high MCI.
Out of 75 samples analyzed, two well water samples (MS 2432 and 2437) exceeded the secondary maximum contamination levels (SMCL) for chloride (Supplementary Fig. S2a, b). Both of these samples were collected from a single location just north of the zone of presumption around the Soles well (Fig. 2, Supplementary Fig. S2a) and the concentrations measured during these samplings were substantially elevated in Br and Cl compared to the other 73 samples (Supplementary Fig. S2). Both samples were collected in October of 2023, more than a year after the frac-out event. The well owners indicated that changes seemed to occur over several months preceding the sampling. Given the location and timing, it is unlikely these elevated concentrations are directly related to the frac-out. To avoid suppressing spatial patterns during characterization in this section, these two samples were excluded from the spatial analysis of MCI and constituent measurements.
With these potential contamination legacies across this landscape, it is challenging to attribute water chemistry to the frac-out without chemical measurements prior to the frac-out. Since the frac-out impacted areas hundreds of meters from the wellhead, the chemistry of these water sources was likely not measured as part of the pre-fracking water quality sampling. Therefore, we are left with approaches like the MCI to evaluate the potential contamination of the water supply. While the MCI is designed to detect O&G brine contributions using ratios, comparison of the MCI with actual concentrations can help evaluate the role of the frac-out in water source contamination. To examine the extent of the frac-out impact, the differences in multiple constituents inside and outside of systematically varied areas around the Fox Hill #1 well were compared.
Patterns of halide concentration suggest unusual chemistry in New Freeport. In general, the average [Cl] in samples with MCI ≥ 3 samples (i.e., not including the high Cl mentioned above) is 41 ppm which is ~ 6 times higher than [Cl] in non-impacted samples (MCI < 3). Only 20% of all 75 samples contained detectable levels of bromide. Thirteen of these 15 samples had an MCI of 6. For the two samples with detectable bromide and an MCI < 6, one sample had a high SO4/Cl ratio and the other a high Mg/Li ratio, diminishing their CCI. No samples with an MCI < 3 contained bromide. Further, when the water sources with measurable bromide were mapped (Supplementary Fig. S3b), 8 of the 13 samples containing Br are within a 2500 foot (762 m) radius of the Fox Hill #1 well and two others located just up the valley from New Freeport. Bromide patterns are difficult to evaluate statistically due to the small number of samples with detectable Br outside the New Freeport area and the resultant large number of samples with concentrations below detection level. If only the Br detects are considered, the sample populations are not significantly different (Supplementary Table S2). However, when non-detects are included as zeros, the samples are significantly different inside the 1000 (305 m), 2000 (610 m), 2500 (762 m), and 5000 foot (1524 m) buffers relative to the sample outside of the buffer. Analysis of Cl also shows a clear difference between areas closer to New Freeport and those further from the Fox Hill #1 well (Fig. 7, Supplementary Table S2). The most statistically significant difference between [Cl] samples collected within the buffer and those outside of the buffer is for the 5000 ft buffer (Fig. 7, Supplementary Table S2).
This systematic examination of concentration samples within and outside various buffers indicates distinct chemistries in the areas surrounding New Freeport (i.e., surrounding the Fox Hill #1 well). All of the ratios move in directions that indicate additional brine influence (lower SO4/Cl, Ca/Sr, Mg/Na, and Mg/Li (see Fig. 6)). In general, these differences are significant for both SO4/Cl and Ca/Sr, though Mg/Na and Mg/Li differences were not significant with the exception of Mg/Na in the 2000 ft buffer. Barium, strontium, and lithium are higher within the buffers around the Fox Hill well (with the exception of Li and Sr at the 1000 ft buffer), with larger differences in means as the buffer sizes increase (Supplementary Table S2). In general, Fe and Mn were lower inside the buffer, however, none of the differences for Fe or Mn are significant except for Fe with non-detects treated as zeros and Mn detects within the 5000 ft buffer (Supplementary Table S2). Finally, methane seems to be lower in the regions near New Freeport when compared to the rest of the region, though the differences are not significant (Supplementary Table S2). This is true for both only comparing methane detects and comparing entire sample sets with non-detects set to zero. While it seems to be assumed that methane distribution should result from the frac-out53 the frac-out is forced by water pressure and the impacts may be driven by the water dynamics rather than gas phase dynamics. Alternatively, frac-out impacts may be focused in terms of water quality but much wider in terms of gas phase impacts. The data presented here are not sufficient to make that determination.
Together this provides a compelling set of evidence that the frac-out resulted in novel chemistry in the groundwaters in New Freeport. Part of that may result from the differences in sampling time. Regardless, this multiple line of evidence approach seems to effectively differentiate these waters based on chemistry characteristic of brines (e.g., Li and Br) but not typical regional groundwater signals (e.g., Fe and Mn). The question is what buffer is most appropriate? The 5000 ft buffer seems to have, in general, a larger difference in means and lower p-values across constituents. Ultimately, this analysis does indicate that smaller buffers (e.g., 1000 ft) seem to miss some of the chemical change (i.e., impacted waters are outside the buffers and depress differences in means and increase p-values). This likely results from some of the impacted waters being part of the sample from outside the buffer, introducing variance in the sample that implies overlapping sample distributions. It seems like at least a 2500 ft buffer around the center of observed frac-out locations should be presumed to be impacted and likely, given the uncertainties in subsurface flow paths, at least a 5000 ft buffer would be more appropriate. The determination of this final value is beyond the scope of the paper, but the current buffer (i.e., 0 feet) is clearly not sufficient.
All of these results underline the challenge in this region. Areas surrounding New Freeport have a legacy of historical coal mining (Fig. 1). This legacy has left both ground and surface water contaminated with heavy metals and other pollutants. Acid mine drainage (AMD) elevates iron, manganese, aluminum, and sulfate concentrations27. In general, the Pittsburgh Coal Seam, one of the most economically important regional coal sources, is too deep in the region (224 m) for economically viable room and pillar mining during historical periods. Therefore, New Freeport surface waters are likely not heavily impacted by legacy AMD. However, regional groundwater chemistry can be poor as a drinking water source27. Among all analyzed samples, 48% exceeded drinking water secondary maximum contaminant levels (SMCL) for manganese concentrations, 36% exceeded iron SMCL, and 25% exceeded aluminum SMCL (Supplementary Fig. S3c, d, e). Nevertheless, these proportions are lower than observations of unimpacted groundwaters presented in the county groundwater report (75% exceedances for iron and manganese)27. Ultimately, the observed [Fe] and [Mn] likely don’t reflect impacts from unconventional extraction activities.
The observations of water quality immediately following a frac-out, particularly when placed in the complicated and challenging regional context, suggest the current regulatory tools are not sufficient to address frac-out impacts. There currently is no area automatically assumed to be impacted by a frac-out. Certainly, pre-drill water quality assessments will not capture conditions in all of the potential areas frac-outs may impact as they are collected much closer to the unconventional well pad. More importantly, the typical water quality testing suites do not take advantage of our most sensitive tracers17. Bromide and lithium, if present in most regional surface and groundwaters, are in relatively low concentrations. Therefore, even a small amount of brine input can be detected. However, the detection limits utilized do not take advantage of this system. A telling example is the operator’s “Area of Review” report following the frac-out53. In the operator’s survey of potentially impacted residential water quality following the frac-out event, the Li and Br quantities are uniformly below a relatively high detection limit or not measured at all. It is very true that if one cannot see our most sensitive tracers, one cannot clearly see contamination. Better detection limits for both constituents are relatively simple (e.g., analyze waters at multiple dilutions and include more dilute standards in calibration curves). Further, the complete absence of Li or Br above regional concentrations would be compelling evidence that brines have not created an impact. Given the regular occurrence of frac-outs, we need to improve our ability to assess the scope and severity of their impact to better mitigate these impacts, including reliable tracer data.
Conclusion
Continued unconventional extraction activities raise the potential for frac-outs and therefore are an important part of environmental risk mitigation. Here, in one of the first reports of the spatial, water chemistry impacts of a frac-out, samples from 75 ground and surface waters samples were used to evaluate an event that occurred in Southwest Pennsylvania.
The patterns of water chemistry impacts are complicated and preclude the use of simple, singular metrics to evaluate water impact (e.g., a bromide concentration). An MCI [Multi-component Contamination Index] was applied to evaluate multiple chemical criteria associated with O&G produced waters (Ca/Sr, SO4/Cl, Br/SO4, Mg/Na, Mg/Li mass ratios and methane concentrations). 98% of the impacted samples with MCI ≥ 3 had measurable levels of methane, suggesting connections to hydraulic fracturing activities. These impacted waters were primarily located in valley bottoms (Pennsylvania Fork of Fish Creek) consistent with migration of methane and water through the fracture zones typically associated with valleys in the region.
In the area surrounding the apparent primary surface conduit of the frac-out (i.e., the Fox Hill #1 well) chemical indicators are consistently and significantly different in the direction of O&G brine when compared to chemistries outside this area. The near frac-out region has a distinct chemistry. Improved regulatory tools to protect people living around frac-outs and exposed to these novel chemistries are vital to more effective future responses.
Finally, in the evaluations of the frac-out, the tendency to not utilize all of the potential chemical tracers (e.g., Br and Li) is a consistent shortcoming in our evaluation of unconventional petroleum extraction impacts. The obscuring of tracer data due to rigidity in simple lab approaches (like sample dilution) is not acceptable and results in incomplete and potentially incorrect assessments of unconventional petroleum extraction impacts.
![]() Refer also to:
Refer also to: