
Worldometers update April 20, 2020
Nitrogen dioxide (NO2) pollution…“may be one of the most important contributors to fatality caused by the COVID-19” a recent study [source] found after analyzing death cases from 66 administrative regions in Italy, Spain, France, and Germany. “Results show that out of the 4443 fatality cases, 3487 (78%) were in five regions located in north Italy and central Spain.
Additionally, the same five regions show the highest NO2 concentrations combined with downwards airflow which prevent an efficient dispersion of air pollution.
These results indicate that the long-term exposure to this pollutant may be one of the most important contributors to fatality caused by the COVID-19 virus in these regions and maybe across the whole world.” [source]
- 83% of all fatalities (3701 cases) occurred in regions where the maximum NO2 concentration was above 100 μmol/m2
- 15.5% (691 cases) occurred in regions where the maximum NO2 concentration was between 50 and 100 μmol/m2
- 1.5% of all fatalities (51 cases) occurred in regions where the maximum NO2 concentration was below 50 μmol/m2
It shall be noted that there are other potentially decisive factors, such as a higher population density or a higher rate of international travel, that are also typical characteristics of urban areas, in addition to higher levels of pollution.
Assessing nitrogen dioxide (NO2) levels as a contributing factor to coronavirus (COVID-19) fatality by Yaron Ogen, Sci Total Environ. 2020 Jul 15; 726: 138605.11., published online April 11, 2020
doi: 10.1016/j.scitotenv.2020.138605
Abstract
Nitrogen dioxide (NO2) is an ambient trace-gas result of both natural and anthropogenic processes. Long-term exposure to NO2 may cause a wide spectrum of severe health problems such as hypertension, diabetes, heart and cardiovascular diseases and even death. The objective of this study is to examine the relationship between long-term exposure to NO2 and coronavirus fatality. The Sentinel-5P is used for mapping the tropospheric NO2 distribution and the NCEP/NCAR reanalysis for evaluating the atmospheric capability to disperse the pollution. The spatial analysis has been conducted on a regional scale and combined with the number of death cases taken from 66 administrative regions in Italy, Spain, France and Germany. Results show that out of the 4443 fatality cases, 3487 (78%) were in five regions located in north Italy and central Spain. Additionally, the same five regions show the highest NO2 concentrations combined with downwards airflow which prevent an efficient dispersion of air pollution.
These results indicate that the long-term exposure to this pollutant may be one of the most important contributors to fatality caused by the COVID-19 virus in these regions and maybe across the whole world.
1. Introduction
The outbreak of the novel coronavirus (COVID-19) is an ongoing global epidemic event which started in the city of Wuhan, China in late 2019. By March 2020 the virus has spread globally and was declared as pandemic by the World Health Organization (World Health Organization, 2020). COVID-19 is an acute respiratory disease which may lead to pneumonia with symptoms such as fever, cough and dyspnea (Jiang et al., 2020) and has an approximate fatality rate of 2–3% (Rodriguez-Morales et al., 2020). As of March 19, 2020, there have been 209,839 confirmed cases and 8788 deaths reported globally. Early studies concluded that the risk factors associated with the development of the disease are older age (Wu et al., 2020), history of smoking (Liu et al., 2020), hypertension and heart disease (Chen et al., 2020). The Italian institute of health (Istituto Superiore di Sanità) reported background diseases of 481 patients in Italy who passed away due to COVID-19 infection. Table 1 shows the information about the most common background diseases which are evident in over 20% of the cases. Furthermore, recent studies suggest that the cause of death of many COVID-19 patients was related to cytokine storm syndrome (Guo et al., 2020; Mehta et al., 2020). This syndrome, also known as hypercytokinemia is an uncontrolled release of proinflammatory cytokines (Tisoncik et al., 2012) and it is a severe reaction of the immune system, leading to a chain of destructive processes in the body that can end in death.
Table 1
The most common background diseases evident in over 20% of the cases.
| Disease | % of patients |
|---|---|
| Hypertension | 73.8 |
| Diabetes | 33.9 |
| Ischemic heart diseases | 30.1 |
| Atrial fibrillation | 22.0 |
| Chronic renal failure | 20.2 |
Many studies have shown that the incidence of these diseases can also be caused by a long exposure to air pollution, especially nitrogen dioxide (NO2), a toxic component. NO2 enters the atmosphere as a result of anthropogenic activity (mostly fossil fuel combustion from vehicles and power plants) and natural processes (lightning and soil processes).
Elevated exposure to NO2 has been associated with hypertension (Saeha et al., 2020), heart and cardiovascular diseases (Gan et al., 2012; Mann Jennifer et al., 2002; Arden et al., 2004), increased rate of hospitalization (Mann Jennifer et al., 2002), chronic obstructive pulmonary disease (COPD) (De et al., 1993; Euler et al., 1988), significant deficits in growth of lung function in children (Avol et al., 2001; James Gauderman et al., 2000), poor lung function in adults or lung injury (Bowatte et al., 2017; Rubenfeld et al., 2005) and diabetes (Saeha et al., 2020).
In addition to these, other studies have focused on the immune system’s response to NO2 exposure. Blomberg et al., 1999, found that exposure to NO2 causes an inflammatory response in the airways and Devalia et al., 1993, showed that these exposures may induce the synthesis of proinflammatory cytokines from airway epithelial cells which consequently play an important role in the etiology (cause) of airway disease. Moreover, the epithelial cells in the lung may be uniquely susceptible to death when exposed to NO2 (Persinger et al., 2002).
High NO2 concentration is significantly associated with respiratory mortality (Beelen et al., 2008; Chen et al., 2007; Hoek et al., 2013) and is also responsible for generating some harmful secondary pollutants such as nitric acid (HNO3) and ozone (O3) (Khoder, 2002). As a result, the WHO has stated that the health risks may potentially occur due to the presence of NO2 or its secondary products (World Health Organization, 2003). Accordingly, the WHO understands the health issues arising from NO2 and suggests that the world population should be protected from exposure to this pollutant.
The objective of this work is to assess the contribution of a long-term exposure to NO2 on coronavirus fatality. This is achieved by combining three databases: the tropospheric concentration of NO2, the atmospheric condition as expressed by the vertical airflow, and the number of fatality cases. The data is processed at the administrative level for each country to obtain high spatial resolution.Go to:
2. Materials and methods
2.1. Fatality database
The data concerning the number of fatality cases was collected from each country on a regional/administrative level. The use of this method is intended to highlight the spatial variation of the epidemic which exists not only between different countries, but more importantly within each country. Moreover, if high mortality rates are observed in two remote regions in two different countries, we need to identify their common factor which may explain mortality. For that, data was collected from 66 administrative regions in Italy, Spain, France and Germany. Information about fatalities was taken from the Ministry of Health (Italy), Ministry of Health, Social Services and Equality (Spain), The National Agency of Public Health (France) and the Robert-Koch-Institute and the State Health Offices (Germany).
2.2. The NO2 spatial distribution
For the NO2 concentration in the troposphere (from surface up to ~10 km), the Sentinel-5 Precursor space-borne satellite (spatial resolution of 5.5 km) was used which is operated and managed by the European Commission under the “Copernicus” program (Fig. 1 ). The satellite operates in a sun-synchronous orbit at 824 km and an orbital cycle of 16 days. The satellite carries a TROPOspheric Monitoring Instrument (TROPOMI) which provides a (near-)global coverage of air pollution caused by NO2 and other pollutants such as O3, SO2, CO, CH4, CH2O and aerosols (Veefkind et al., 2012).

Open in a separate window Fig. 1
The tropospheric NO2 distribution.
For this study, long-term exposure was defined as a two-month period (January–February 2020) prior to the outbreak of COVID-19 in Europe. The spatial data was collected using the Google Earth Engine API (Gorelick et al., 2017). The global coverage of tropospheric NO2 for this time period was extracted using 832 different images followed by calculating the mean concentration for each administrative region. Subsequently, only the maximum concentration value was used due to differences in the size of the regions.
2.3. The atmospheric condition
Due to the thickness of the troposphere, the value which represents the NO2 concentration is not enough. There is also a need to understand the vertical airflow during the same period of the event. For that purpose, the vertical airflows at 850 mb (~1.5 km above sea level) was used as it defines the atmospheric capability to disperse the gas (Fig. 2 ). This data was provided by the NOAA/OAR/ESRL PSD, Boulder, Colorado, USA (http://www.esrl.noaa.gov/psd/). Downwards airflows are given by positive values of omega (in Pa/s), while upwards airflow by negative values of omega. In regions where positive omega is observed, the atmospheric will force the NO2 to stay close to the surface which leads the population to be exposed to the risk factor. In contrast, in regions with negative omega, the atmospheric conditions will disperse the gas further away and to higher altitudes. In these regions, the population is less exposed to the air pollution and to its associated health risks.

Open in a separate window Fig. 2
The vertical airflow (omega) at 850 mb (~1500 m above sea level).
3. Results
Mapping the tropospheric NO2 over Europe reveals a major ‘hotspot’ of high concentration in the northern part of Italy. The ‘hotspot’ is observed in the Po valley which extends from the slopes of the western Alps to the coastal plains of the Adriatic Sea. Out of the top five regions where high fatality was observed, four of them were in northern Italy (Fig. 3 ): Lombardia, (2168 cases), Emilia-Romanga (531), Piemonte (175 cases) and Veneto (115 cases). The other region was in the administrative region ‘Community of Madrid’ (Comunidad de Madrid), Spain (498 cases) which, like the Po valley, is also surrounded by mountain ranges.

Open in a separate window Fig. 3
NO2 vs. the absolute number of death cases.
As shown in Fig. 4 , 78% of all fatalities due to coronavirus in these selected countries occurred in those regions. The concentrations of NO2 were high and ranged between 177.1 and 293.7 μmol/m2, accompanied by downwards airflows (positive omega ranged between 0.04 and 0.07 Pa/s).Open in a separate windowFig. 4
The mean death cases and the percentage of deaths in each NO2 concentration range.
There were 4443 fatalities in these countries due to COVID-19 by March 19, 2020. 83% of all fatalities (3701 cases) occurred in regions where the maximum NO2 concentration was above 100 μmol/m2, 15.5% (691 cases) occurred in regions where the maximum NO2 concentration was between 50 and 100 μmol/m2, and only 1.5% of all fatalities (51 cases) occurred in regions where the maximum NO2 concentration was below 50 μmol/m2.
4. Discussion and conclusion
In this study, the concentrations of the tropospheric NO2 which were extracted from the Sentinel-5P satellite were used in order to explain the spatial variation of fatality cases in 66 administrative regions in four European countries. The Sentinel-5P data shows two main NO2 hotspots over Europe: Northern Italy and Madrid metropolitan area. According to these results, high NO2 concentration accompanied by downwards airflows cause of NO2 buildup close to the surface. This topographic structure combined with atmospheric conditions of inversion (positive omega) prevent the dispersion of air pollutants, which can cause a high incidence of respiratory problems and inflammation in the local population. This chronic exposure could be an important contributor to the high COVID-19 fatality rates observed in these regions. As earlier studies have shown that exposure to NO2 causes inflammatory in the lungs, it is now necessary to examine whether the presence of an initial inflammatory condition is related to the response of the immune system to the coronavirus.
Hence, poisoning our environment means poisoning our own body and when it experiences a chronic respiratory stress, its ability to defend itself from infections is limited.
According to these results, more studies should be conducted which focus on additional factors such as age and presence of pre-existing and background diseases along with the impact of pre-exposure to NO2 and hypercytokinemia in order to verify their impact on fatalities due to the COVID-19 pandemic.
Declaration of competing interest
The author declares no known competing financial interests or personal relationships that could have appeared to influence the work reported in this paper.
Acknowledgments
I wish to thank Prof. Michael Hopp for his assistance with the drafting and Prof. Hadas Saaroni for her assistance with the analysis of the atmospheric data. Prof. Hopp and Prof. Saaroni are faculty members in the Department of Geography and the Human Environment at Tel-Aviv University. None of these individuals received compensation for their contributions.
References
- Arden Pope C., Burnett Richard T., Thurston George D., Thun Michael J., Calle Eugenia E., Daniel Krewski, Godleski John J. Cardiovascular mortality and long-term exposure to particulate air pollution. Circulation. 2004;109:71–77. [PubMed] [Google Scholar]
- Avol E.L., Gauderman W.J., Tan S.M., London S.J., Peters J.M. Respiratory effects of relocating to areas of differing air pollution levels. Am. J. Respir. Crit. Care Med. 2001;164:2067–2072. [PubMed] [Google Scholar]
- Beelen Rob, Hoek Gerard, van den Brandt Piet A., Goldbohm R. Alexandra, Fischer Paul, Schouten Leo J., Jerrett Michael, Hughes Edward, Armstrong Ben, Brunekreef Bert. Long-term effects of traffic-related AIR pollution on mortality in a Dutch cohort (NLCS-AIR study) Environ. Health Perspect. 2008;116:196–202. [PMC free article] [PubMed] [Google Scholar]
- Blomberg A., Krishna M.T., Helleday R., Söderberg M., Ledin M.-C., Kelly F.J., Frew A.J., Holgate S.T., Sandström T. Persistent airway inflammation but accommodated antioxidant and lung function responses after repeated daily exposure to nitrogen dioxide. Am. J. Respir. Crit. Care Med. 1999;159:536–543. [PubMed] [Google Scholar]
- Bowatte G., Erbas B., Lodge C.J., Knibbs L.D., Gurrin L.C., Marks G.B., Thomas P.S., Johns D.P., Giles G.G., Hui J. Traffic-related air pollution exposure over a 5-year period is associated with increased risk of asthma and poor lung function in middle age. Eur. Respir. J. 2017;50 [PubMed] [Google Scholar]
- Chen T.-M., Kuschner W.G., Gokhale J., Shofer S. Outdoor air pollution: nitrogen dioxide, sulfur dioxide, and carbon monoxide health effects. Am J Med Sci. 2007;333:249–256. [PubMed] [Google Scholar]
- Chen M., Fan Y., Wu X., Zhang L., Guo T., Deng K., Cao J., Luo H., He T., Gong Y. Social Science Research Network; Rochester, NY: 2020. Clinical Characteristics and Risk Factors for Fatal Outcome in Patients With 2019-Coronavirus Infected Disease (COVID-19) in Wuhan, China. [Google Scholar]
- De A., Sd C., Pk M., R B., Wl B., Y T. Chronic disease associated with long-term concentrations of nitrogen dioxide. J. Expo. Anal. Environ. Epidemiol. 1993;3:181–202. [PubMed] [Google Scholar]
- Devalia J.L., Campbell A.M., Sapsford R.J., Rusznak C., Quint D., Godard P., Bousquet J., Davies R.J. Effect of nitrogen dioxide on synthesis of inflammatory cytokines expressed by human bronchial epithelial cells in vitro. Am. J. Respir. Cell Mol. Biol. 1993;9:271–278. [PubMed] [Google Scholar]
- Euler G.L., Abbey D.E., Hodgkin J.E., Magie A.R. Chronic obstructive pulmonary disease symptom effects of long-term cumulative exposure to ambient levels of total oxidants and nitrogen dioxide in California Seventh-day Adventist residents. Arch. Environ. Health Int. J. 1988;43:279–285. [PubMed] [Google Scholar]
- Gan W.Q., Davies H.W., Koehoorn M., Brauer M. Association of long-term exposure to community noise and traffic-related air pollution with coronary heart disease mortality. Am. J. Epidemiol. 2012;175:898–906. [PubMed] [Google Scholar]
- Gorelick N., Hancher M., Dixon M., Ilyushchenko S., Thau D., Moore R. Google Earth Engine: planetary-scale geospatial analysis for everyone. Remote Sens. Environ. 2017;202:18–27. [Google Scholar]
- Guo Y.-R., Cao Q.-D., Hong Z.-S., Tan Y.-Y., Chen S.-D., Jin H.-J., Tan K.-S., Wang D.-Y., Yan Y. The origin, transmission and clinical therapies on coronavirus disease 2019 (COVID-19) outbreak – an update on the status. Mil. Med. Res. 2020;7:11. [PMC free article] [PubMed] [Google Scholar]
- Hoek G., Krishnan R.M., Beelen R., Peters A., Ostro B., Brunekreef B., Kaufman J.D. Long-term air pollution exposure and cardio- respiratory mortality: a review. Environ. Health. 2013;12:43. [PMC free article] [PubMed] [Google Scholar]
- James Gauderman W., McCONNELL R., Gilliland F., London S., Thomas D., Avol E., Vora H., Berhane K., Rappaport E.B., Lurmann F. Association between air pollution and lung function growth in southern California children. Am. J. Respir. Crit. Care Med. 2000;162:1383–1390. [PubMed] [Google Scholar]
- Jiang F., Deng L., Zhang L., Cai Y., Cheung C.W., Xia Z. Review of the clinical characteristics of coronavirus disease 2019 (COVID-19) J. Gen. Intern. Med. 2020 [PubMed] [Google Scholar]
- Khoder M.I. Atmospheric conversion of sulfur dioxide to particulate sulfate and nitrogen dioxide to particulate nitrate and gaseous nitric acid in an urban area. Chemosphere. 2002;49:675–684. [PubMed] [Google Scholar]
- Liu W., Tao Z.-W., Lei W., Ming-Li Y., Kui L., Ling Z., Shuang W., Yan D., Jing L., Liu H.-G. Analysis of factors associated with disease outcomes in hospitalized patients with 2019 novel coronavirus disease. Chin. Med. J. 2020 (Publish Ahead of Print) [PMC free article] [PubMed] [Google Scholar]
- Mann Jennifer K., Tager Ira B., Fred Lurmann, Mark Segal, Quesenberry Charles P., Lugg Marlene M., Jun Shan, Van Den Eeden Stephen K. Air pollution and hospital admissions for ischemic heart disease in persons with congestive heart failure or arrhythmia. Environ. Health Perspect. 2002;110:1247–1252. [PMC free article] [PubMed] [Google Scholar]
- Mehta P., McAuley D.F., Brown M., Sanchez E., Tattersall R.S., Manson J.J. COVID-19: consider cytokine storm syndromes and immunosuppression. Lancet. 2020;395:1033–1034. [PubMed] [Google Scholar]
- Persinger R.L., Poynter M.E., Ckless K., Janssen-Heininger Y.M.W. Molecular mechanisms of nitrogen dioxide induced epithelial injury in the lung. Mol. Cell. Biochem. 2002;234:71–80. [PubMed] [Google Scholar]
- Rodriguez-Morales A.J., Bonilla-Aldana D.K., Tiwari R., Sah R., Rabaan A.A., Dhama K. COVID-19, an emerging coronavirus infection: current scenario and recent developments – an overview. J. Pure Appl. Microbiol. 2020;9 [Google Scholar]
- Rubenfeld G.D., Caldwell E., Peabody E., Weaver J., Martin D.P., Neff M., Stern E.J., Hudson L.D. Incidence and outcomes of acute lung injury. N. Engl. J. Med. 2005;353:1685–1693. [PubMed] [Google Scholar]
- Saeha Shin, Li Bai, Oiamo Tor H., Burnett Richard T., Scott Weichenthal, Michael Jerrett, Kwong Jeffrey C., Goldberg Mark S., Ray Copes, Alexander Kopp. Association between road traffic noise and incidence of diabetes mellitus and hypertension in Toronto, Canada: a population-based cohort study. J. Am. Heart Assoc. 2020;9 [PubMed] [Google Scholar]
- Tisoncik J.R., Korth M.J., Simmons C.P., Farrar J., Martin T.R., Katze M.G. Into the eye of the cytokine storm. Microbiol. Mol. Biol. Rev. 2012;76:16–32. [PMC free article] [PubMed] [Google Scholar]
- Veefkind J.P., Aben I., McMullan K., Förster H., de Vries J., Otter G., Claas J., Eskes H.J., de Haan J.F., Kleipool Q. TROPOMI on the ESA Sentinel-5 Precursor: a GMES mission for global observations of the atmospheric composition for climate, air quality and ozone layer applications. Remote Sens. Environ. 2012;120:70–83. [Google Scholar]
- World Health Organization . 2003. Health Aspects of Air Pollution With Particulate Matter, Ozone and Nitrogen Dioxide: Report on a WHO Working Group, Bonn, Germany 13–15 January 2003. [Google Scholar]
- World Health Organization Coronavirus disease 2019 (COVID-19) situation report – 51. 2020. https://www.who.int/emergencies/diseases/novel-coronavirus-2019/situation-reports
- Wu C., Chen X., Cai Y., Xia J., Zhou X., Xu S., Huang H., Zhang L., Zhou X., Du C. Risk factors associated with acute respiratory distress syndrome and death in patients with coronavirus disease 2019 pneumonia in Wuhan, China. JAMA Intern. Med. 2020 Published online March 13, 2020. [PMC free article] [PubMed] [Google Scholar]
Refer also to:
2020 01 15: Air pollution from oil and gas production sites visible from space
Oil and gas production has doubled in some parts of the United States in the last two years, and scientists can use satellites to see impacts of that trend: a significant increase in the release of the lung-irritating air pollutant nitrogen dioxide, for example, and a more-than-doubling of the amount of gas flared into the atmosphere.
“We see the industry’s growing impact from space,” said Barbara Dix, a scientist at the Cooperative Institute for Research in Environmental Sciences (CIRES) at the University of Colorado Boulder and lead author of the new assessment published in the AGU journal Geophysical Research Letters. “We really are at the point where we can use satellite data to give feedback to companies and regulators, and see if they are successful in regulating emissions.”
Dix and a team of U.S. and Dutch researchers set out to see if a suite of satellite-based instruments could help scientists understand more about nitrogen oxides pollution (including nitrogen dioxide) coming from engines in U.S. oil and gas fields. Combustion engines produce nitrogen oxides, which is a respiratory irritant and can lead to the formation of other types of harmful air pollutants, such as ground-level ozone.
On oil and gas drilling and production sites, there may be several small and large combustion engines, drilling, compressing gas, separating liquids and gases, and moving gas and oil through pipes and storage containers, said co-author Joost de Gouw, a CIRES Fellow and chemistry professor at CU Boulder. The emissions of those engines are not controlled. “Cars have catalytic converters, big industrial stacks may have emissions reduction equipment…” de Gouw said. “Not so with these engines.”
Encana (cowardly changed name to Ovintiv) compressors polluting near Ernst’s home and the hamlet of Rosebud, Alberta, two of many in the immediate area.
Conventional “inventories” meant to account for nitrogen oxides pollution from oil and gas sites are often very uncertain, underestimating or overestimating the pollutants, de Gouw said. And there are few sustained measurements of nitrogen oxides in many of the rural areas where oil and gas development often takes place, Dix said.
So she, de Gouw and their colleagues turned to nitrogen dioxide data from the Ozone Monitoring Instrument (OMI) on board a NASA satellite and the Tropospheric Monitoring Instrument (TropOMI) on a European Space Agency satellite. They also looked at gas flaring data from an instrument on the NOAA/NASA Suomi satellite system.
Between 2007 and 2019, across much of the United States, nitrogen dioxide pollution levels dropped because of cleaner cars and power plants, the team found, confirming findings reported previously. The clean air trend in satellite data was most obvious in urban areas of California, Washington and Oregon and in the eastern half of the continental United States. “We’ve cleaned up our act a lot,” Dix said.
However, several areas stuck out with increased emissions of nitrogen dioxide: The Permian, Bakken and Eagle Ford oil and gas basins, in Texas and New Mexico, North Dakota, and Texas, respectively.
In those areas, the scientists used a type of time-series analysis to figure out where the pollutant was coming from: Drilling of new wells vs. longer-term production. They could do this kind of analysis because drilling activity swings up and down quickly in response to market forces while production changes far more slowly (once a well is drilled, it may produce oil and natural gas for years or even decades).
Before a downturn in drilling in 2015, drilling generated about 80 percent of nitrogen dioxide from oil and gas sites, the team reported. After 2015, drilling and production produced roughly equal amounts of the pollutant. Flaring is estimated to contribute up to 10 percent in both time frames.
The researchers also developed a new oil and gas emissions inventory, using data on fuel use by the industry, the location of drilling rigs, and well-level production data. The inventory confirmed the satellite trends, said co-author Brian McDonald, a CIRES scientist working in NOAA’s Chemical Sciences Division, “It is a promising development that what we observe from space can be explained by expected trends in emissions from the oil and gas industry.”
“Scientifically, this is especially important: we can do source attribution by satellite,” de Gouw said. “We need to know the important sources to address these emissions in the most cost-efficient manner.”

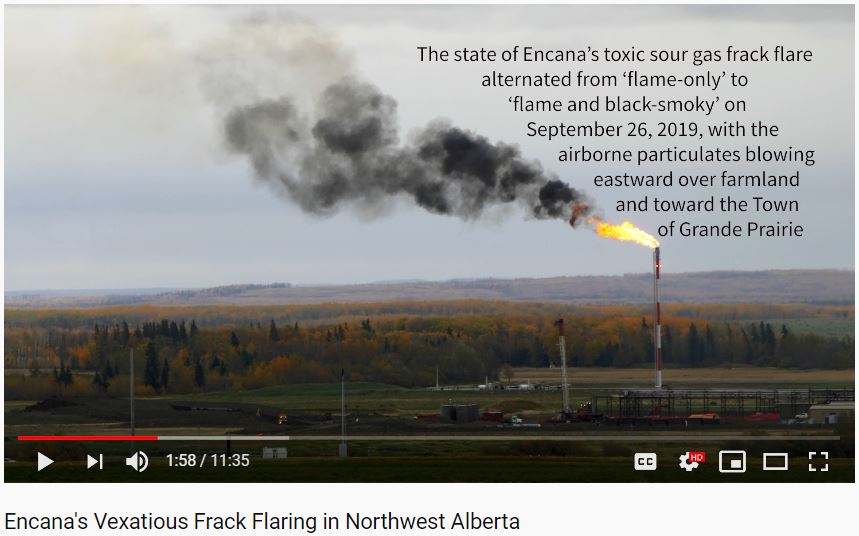
A few of the comments to the video on youtube:
David Stone To all the overpaid top management at Encana. I have now come to the conclusion as a shareholder that Encana is another Canadian run company with overpaid incompetent top management. The top management and board of directors has totally failed at protecting and growing shareholder value $$… So if you doubt what I’m saying just look at the one year stock chart as proof. If I ran company in the US like this I would’ve been fired. Shame on all of you incompetent failures at Encana. Remember excellence is never an accident failure is a choice.
Cineplex Rex Video is well done!
Ross Muirhead This video re-confirms that Alberta is an Oil & Gas State. Corporate Profits rule over a clean environment and peoples health. Koop provides the inside story on this flaring controversy that is shocking. Wake up Alberta Encana does not care about your children.
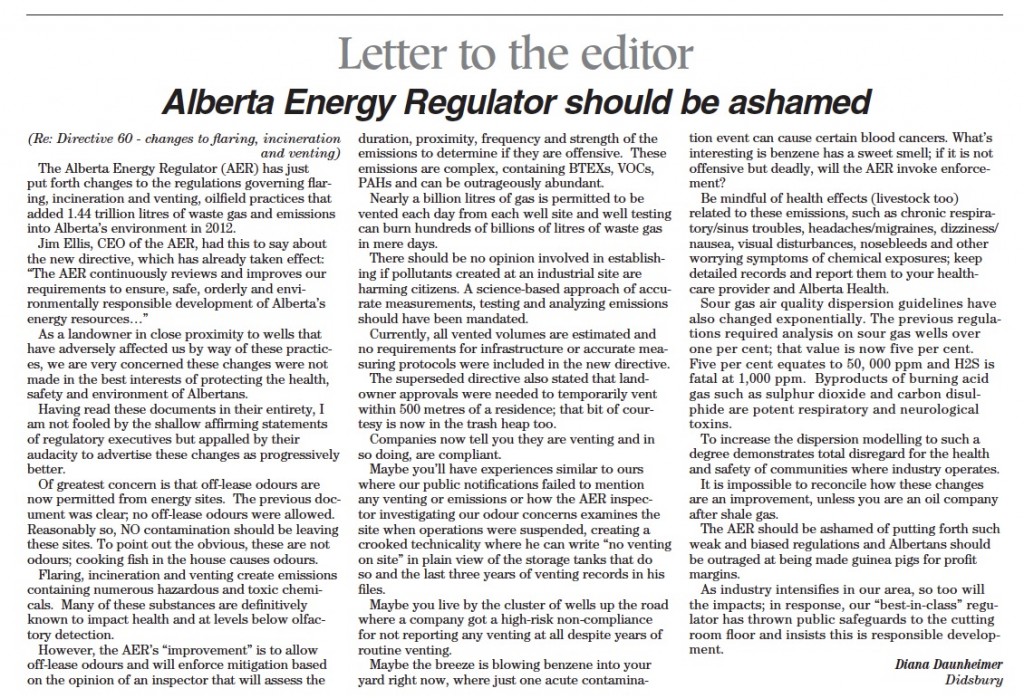
2015 08 30: Toxic taint: Tests in Alberta industrial heartland reveal air-quality concerns
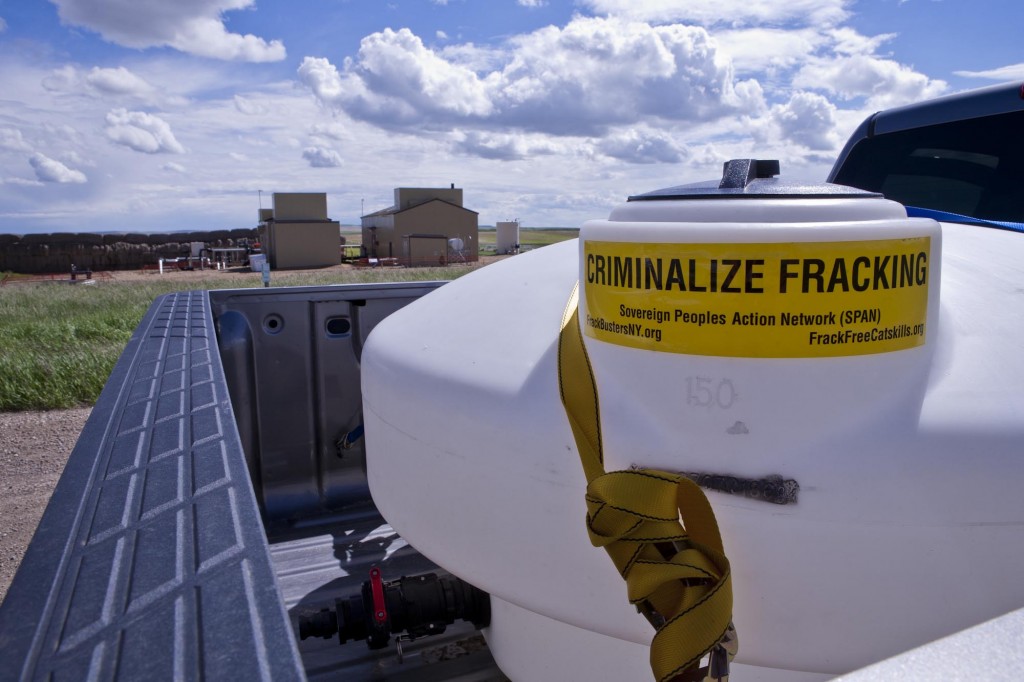
… Of greatest concern is that off-lease odours are now permitted from energy sites. The previous document was clear; no off-lease odours were allowed. Reasonably so, NO contamination should be leaving these sites. To point out the obvious, these are not odours; cooking fish in the house causes odours.
Flaring, incineration and venting create emissions containing numerous hazardous and toxic chemicals. Many of these substances are definitively known to impact health and at levels below olfactory detection. …
Click on image below to read Ms. Daunheimer’s excellent letter. It’s slow to load.
Many more studies proving the oil and gas industry’s health harms posted on this site.